Barclays Investment Banking Pitch Book
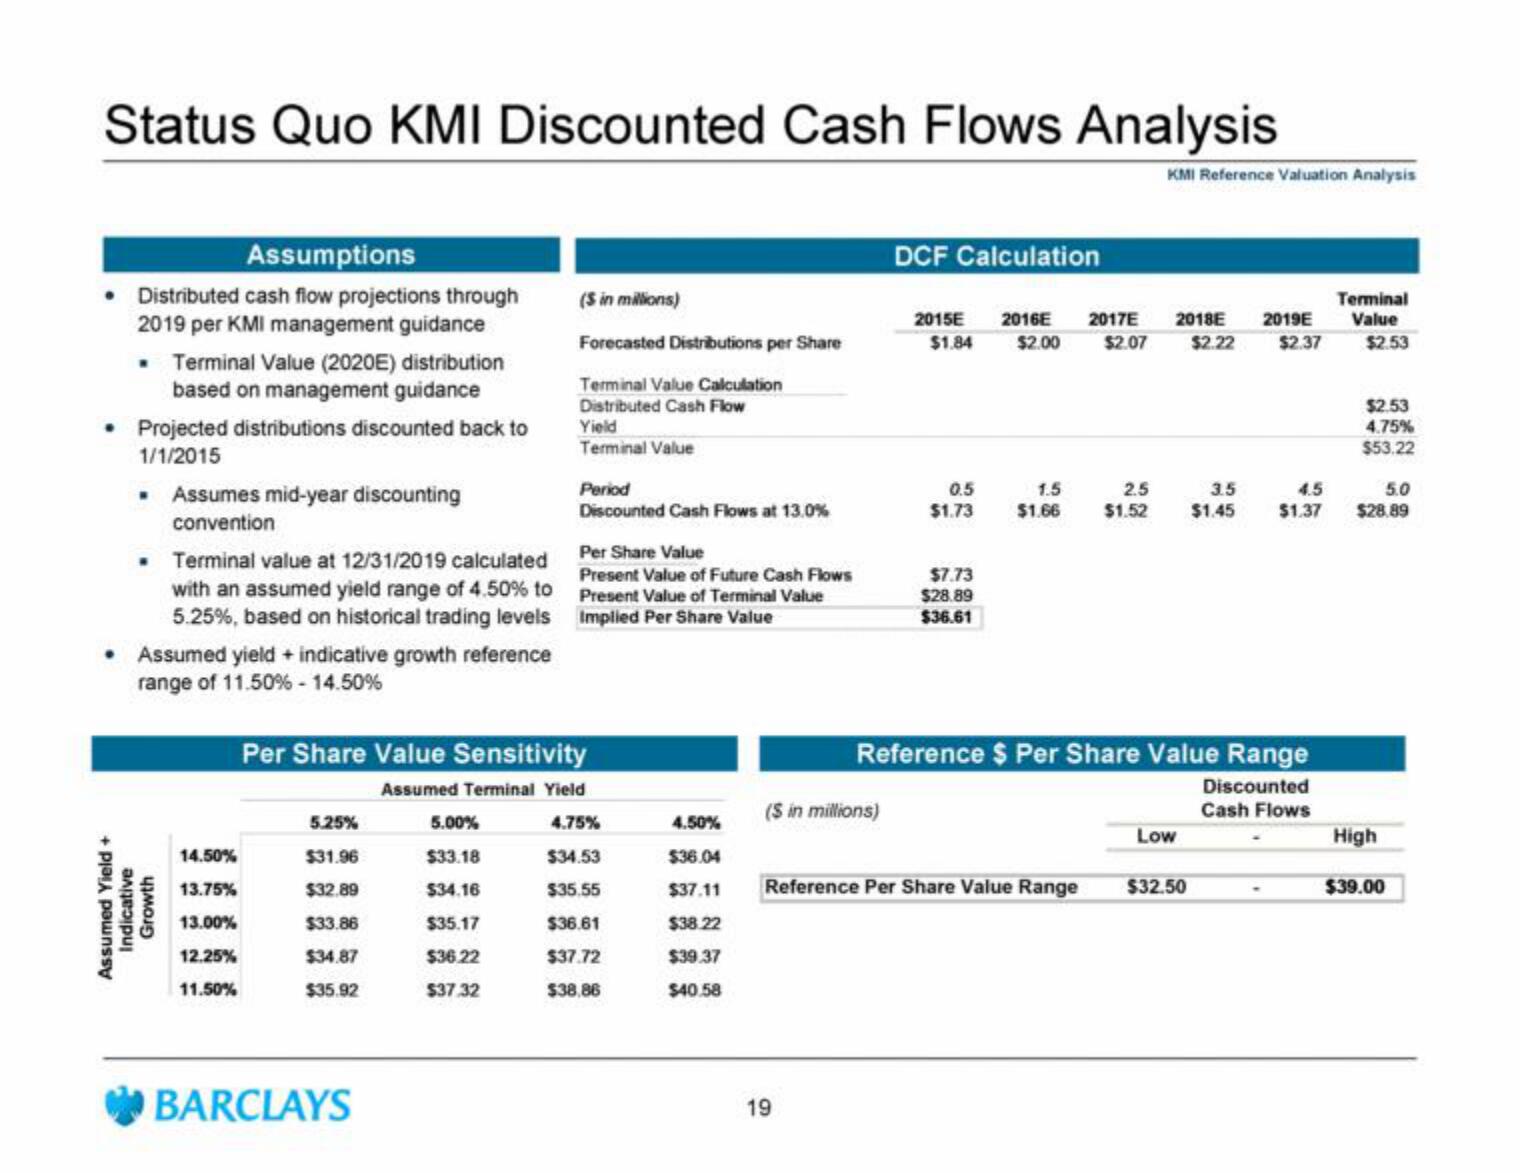
Status Quo KMI Discounted Cash Flows Analysis
Assumptions
Distributed cash flow projections through
2019 per KMI management guidance
. Terminal Value (2020E) distribution
based on management guidance
• Projected distributions discounted back to
1/1/2015
. Assumes mid-year discounting
convention
• Assumed yield + indicative growth reference
range of 11.50 % -14.50%
Assumed Yield +
Indicative
Growth
• Terminal value at 12/31/2019 calculated Per Share Value
with an assumed yield range of 4.50% to
5.25%, based on historical trading levels
14.50%
13.75%
13.00%
12.25%
11.50%
5.25%
$31.96
$32.89
$33.86
$34.87
$35.92
(S in millions)
Forecasted Distributions per Share
Terminal Value Calculation
Distributed Cash Flow
BARCLAYS
Yield
Terminal Value
5.00%
$33.18
$34.16
$35.17
$36.22
$37.32
Period
Discounted Cash Flows at 13.0%
Per Share Value Sensitivity
Assumed Terminal Yield
4.75%
$34.53
$35.55
$36.61
$37.72
$38.86
Present Value of Future Cash Flows
Present Value of Terminal Value
Implied Per Share Value
4.50%
$36.04
$37.11
$38.22
$39.37
$40.58
($ in millions)
DCF Calculation
19
2015E
$1.84
0.5
$1.73
$7.73
$28.89
$36.61
2016E 2017E
$2.00 $2.07
1.5
$1.66
Reference Per Share Value Range
2.5
$1.52
KMI Reference Valuation Analysis
2018E 2019E
$2.22
$2.37
Reference $ Per Share Value Range
Discounted
Cash Flows
Low
3.5
$1.45
$32.50
4.5
$1.37
Terminal
Value
$2.53
$2.53
4.75%
$53.22
5.0
$28.89
High
$39.00View entire presentation