Marti SPAC Presentation Deck
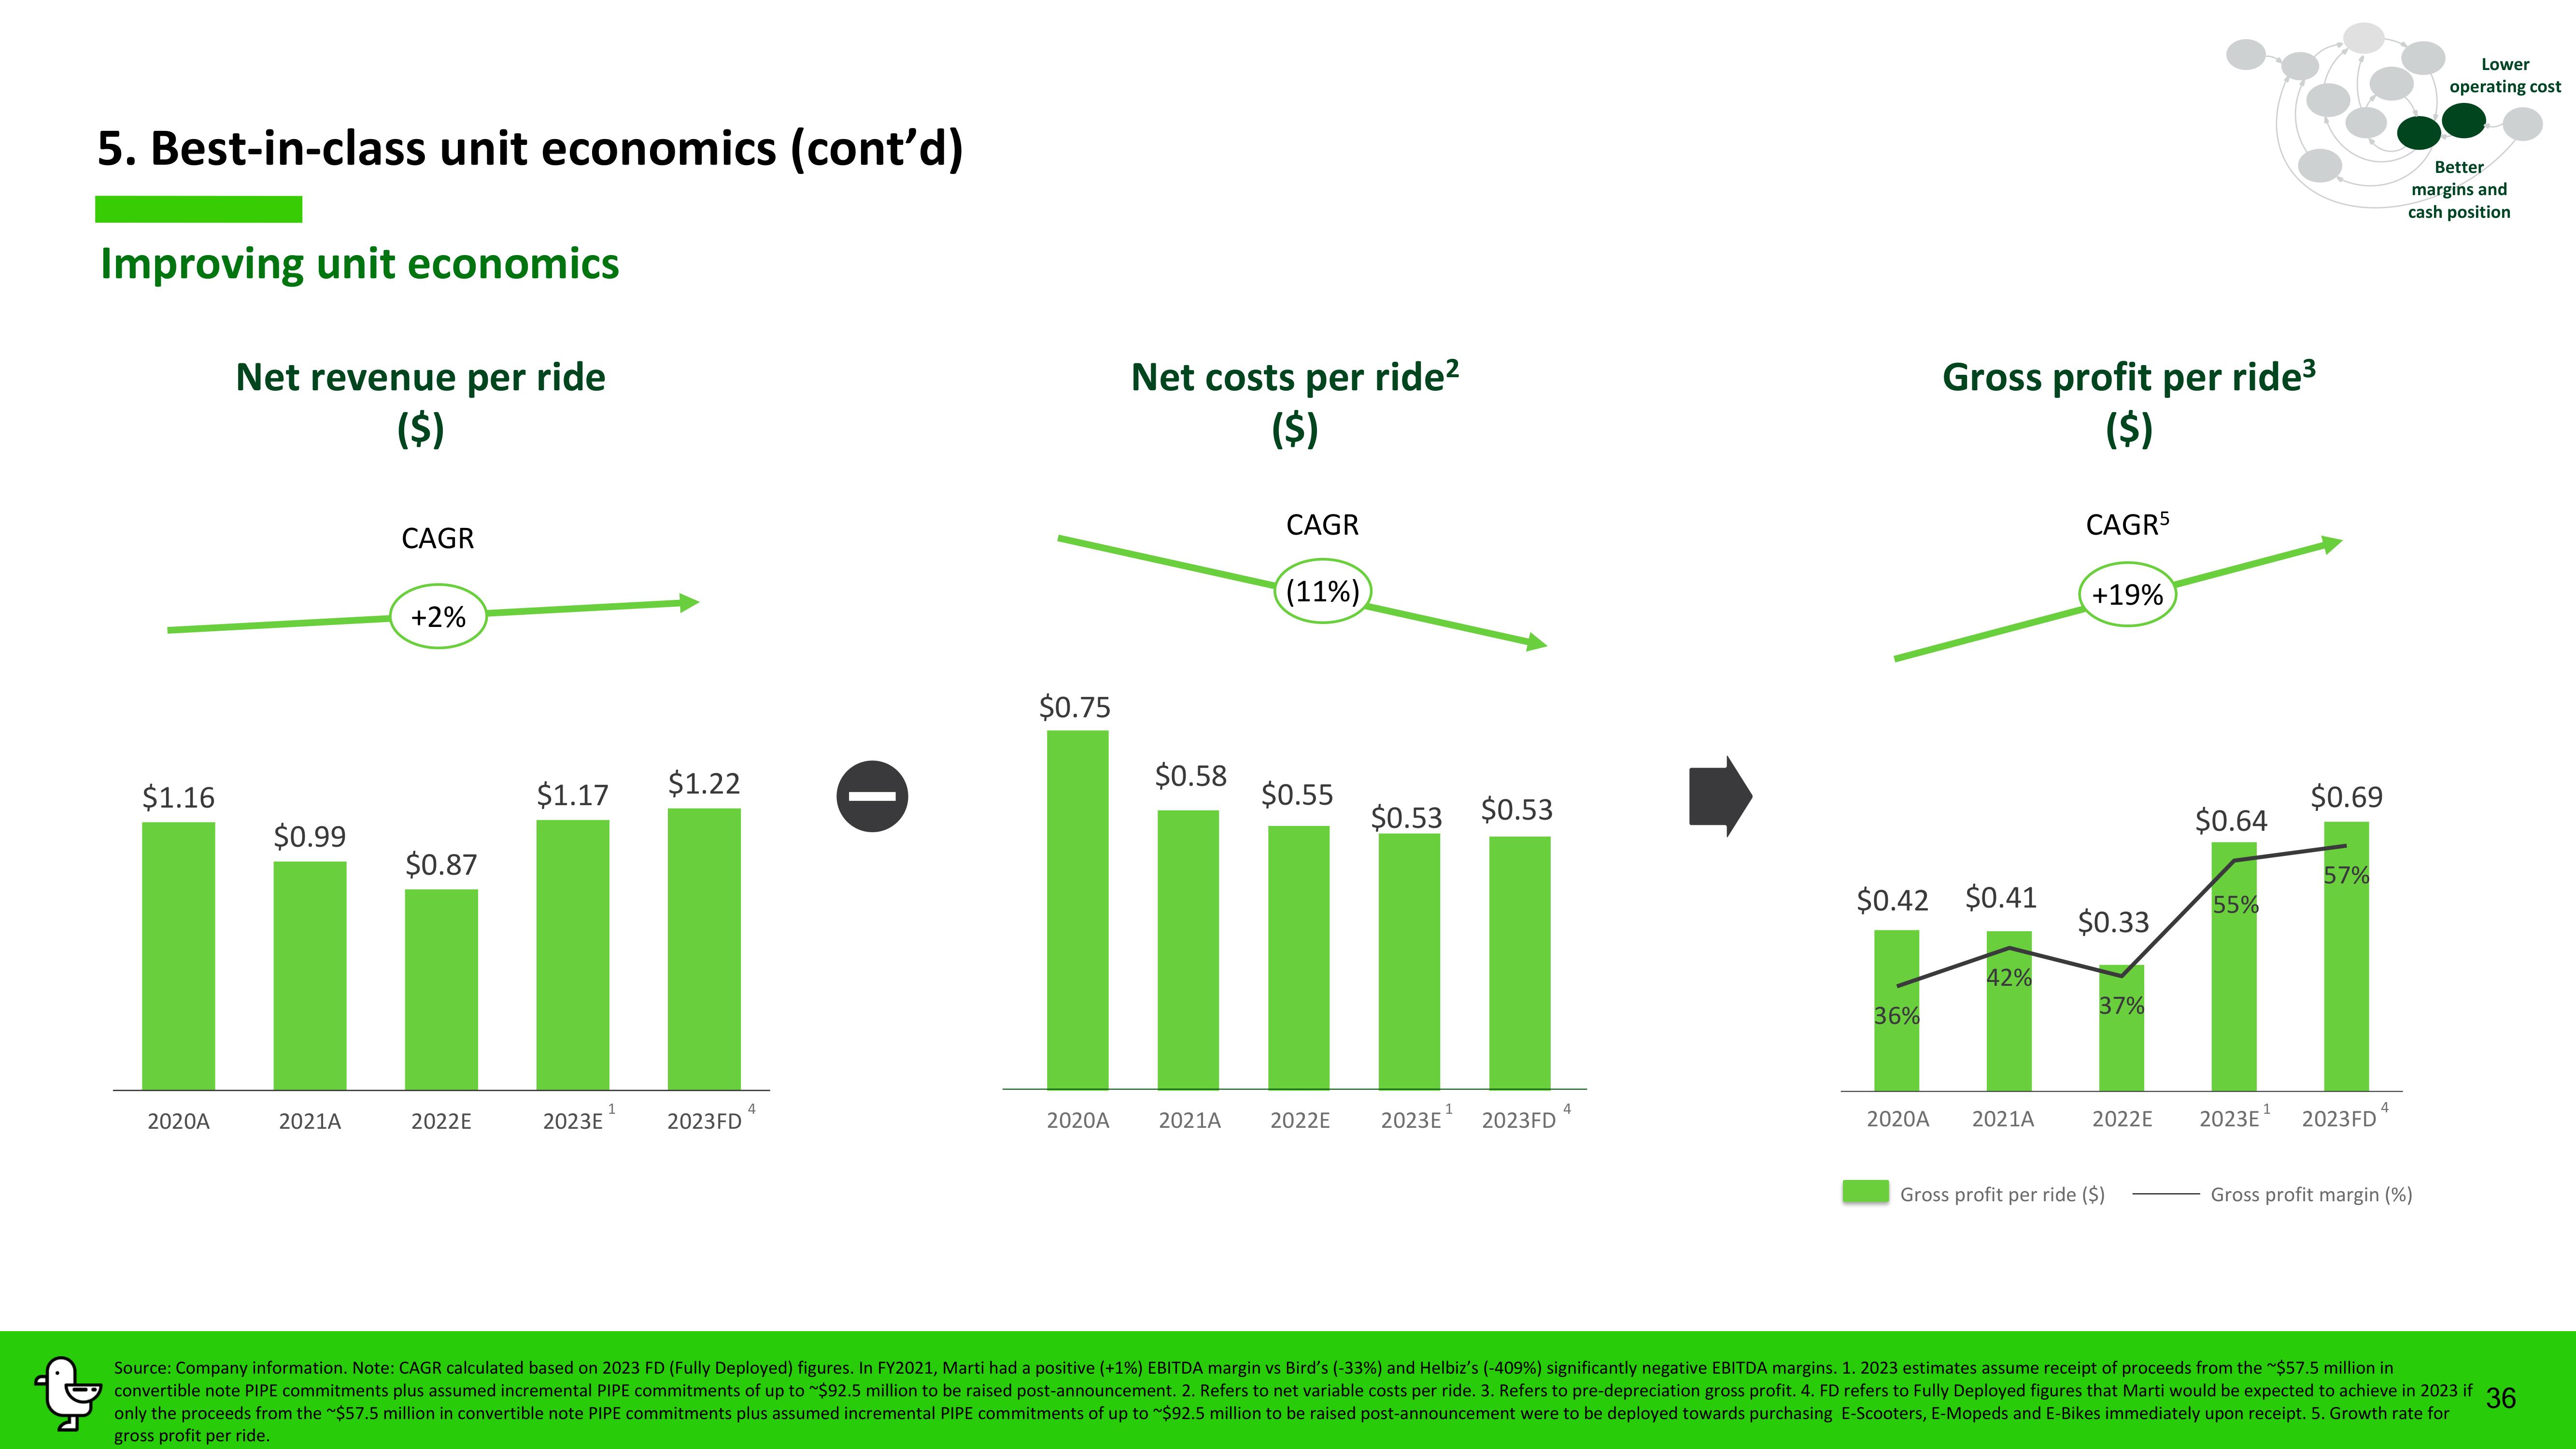
5. Best-in-class unit economics (cont'd)
Improving unit economics
$1.16
2020A
Net revenue per ride
($)
$0.99
2021A
CAGR
+2%
$0.87
2022E
$1.17
2023E
$1.22
2023FD
$0.75
Net costs per ride²
($)
$0.58
CAGR
(11%)
$0.55
$0.53 $0.53
2020A 2021A 2022E 2023E¹ 2023FD
$0.42 $0.41
36%
Gross profit per ride³
($)
2020A
42%
2021A
CAGR5
+19%
$0.33
37%
2022E
Gross profit per ride ($)
$0.64
55%
2023E¹
$0.69
57%
2023FD
Lower
operating cost
Better
margins and
cash position
Gross profit margin (%)
Source: Company information. Note: CAGR calculated based on 2023 FD (Fully Deployed) figures. In FY2021, Marti had a positive (+1%) EBITDA margin vs Bird's (-33%) and Helbiz's (-409 %) significantly negative EBITDA margins. 1. 2023 estimates assume receipt of proceeds from the ~$57.5 million in
convertible note PIPE commitments plus assumed incremental PIPE commitments of up to $92.5 million to be raised post-announcement. 2. Refers to net variable costs per ride. 3. Refers to pre-depreciation gross profit. 4. FD refers to Fully Deployed figures that Marti would be expected to achieve in 2023 if 36
only the proceeds from the ~$57.5 million in convertible note PIPE commitments plus assumed incremental PIPE commitments of up to $92.5 million to be raised post-announcement were to be deployed towards purchasing E-Scooters, E-Mopeds and E-Bikes immediately upon receipt. 5. Growth rate for
gross profit per ride.View entire presentation