Cyxtera Results Presentation Deck slide image

Cyxtera Results Presentation Deck

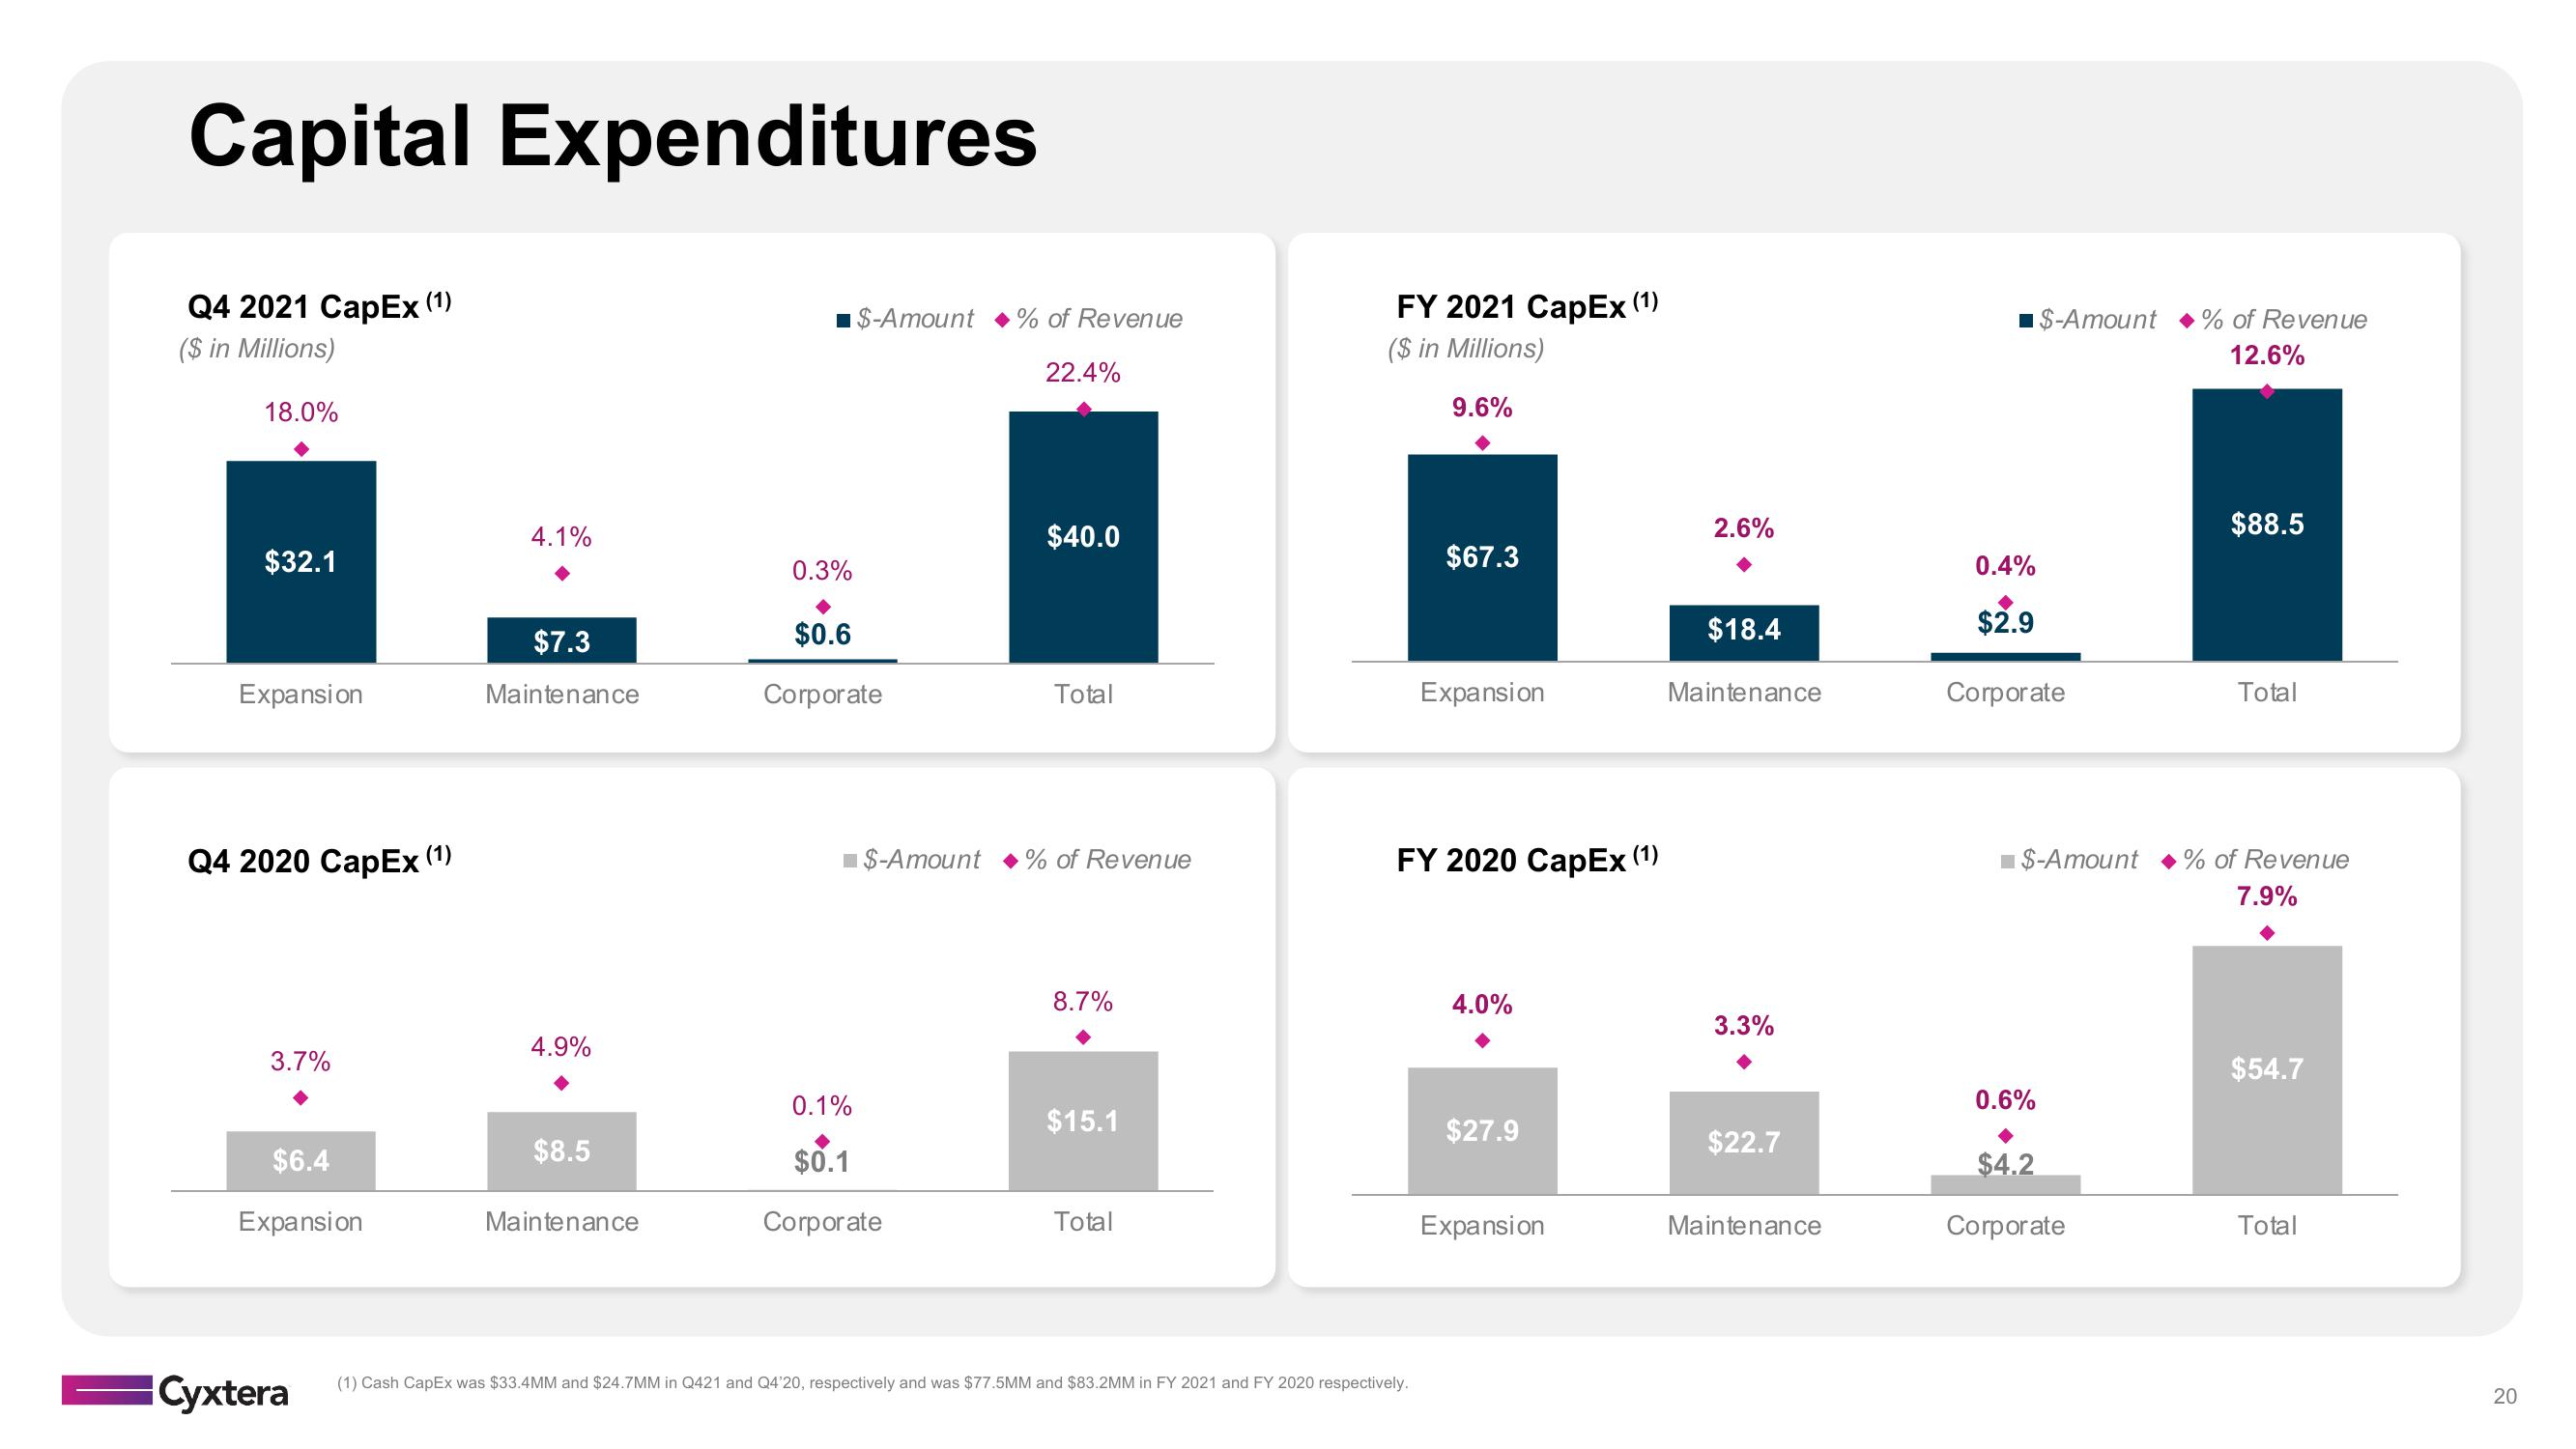
Capital Expenditures Q4 2021 CapEx (1) ($ in Millions) 18.0% $32.1 Expansion Q4 2020 CapEx (1) 3.7% $6.4 Expansion Cyxtera 4.1% $7.3 Maintenance 4.9% $8.5 Maintenance ■ $-Amount % of Revenue 0.3% $0.6 Corporate 22.4% 0.1% $0.1 Corporate $40.0 Total $-Amount % of Revenue 8.7% $15.1 Total FY 2021 CapEx (1) ($ in Millions) 9.6% $67.3 (1) Cash CapEx was $33.4MM and $24.7MM in Q421 and Q4'20, respectively and was $77.5MM and $83.2MM in FY 2021 and FY 2020 respectively. Expansion FY 2020 CapEx (1) 4.0% $27.9 Expansion 2.6% $18.4 Maintenance 3.3% $22.7 Maintenance $-Amount% of Revenue 12.6% 0.4% $2.9 Corporate ■$-Amount 0.6% $4.2 Corporate $88.5 Total % of Revenue 7.9% $54.7 Total 20
View entire presentation