Snowflake Results Presentation Deck
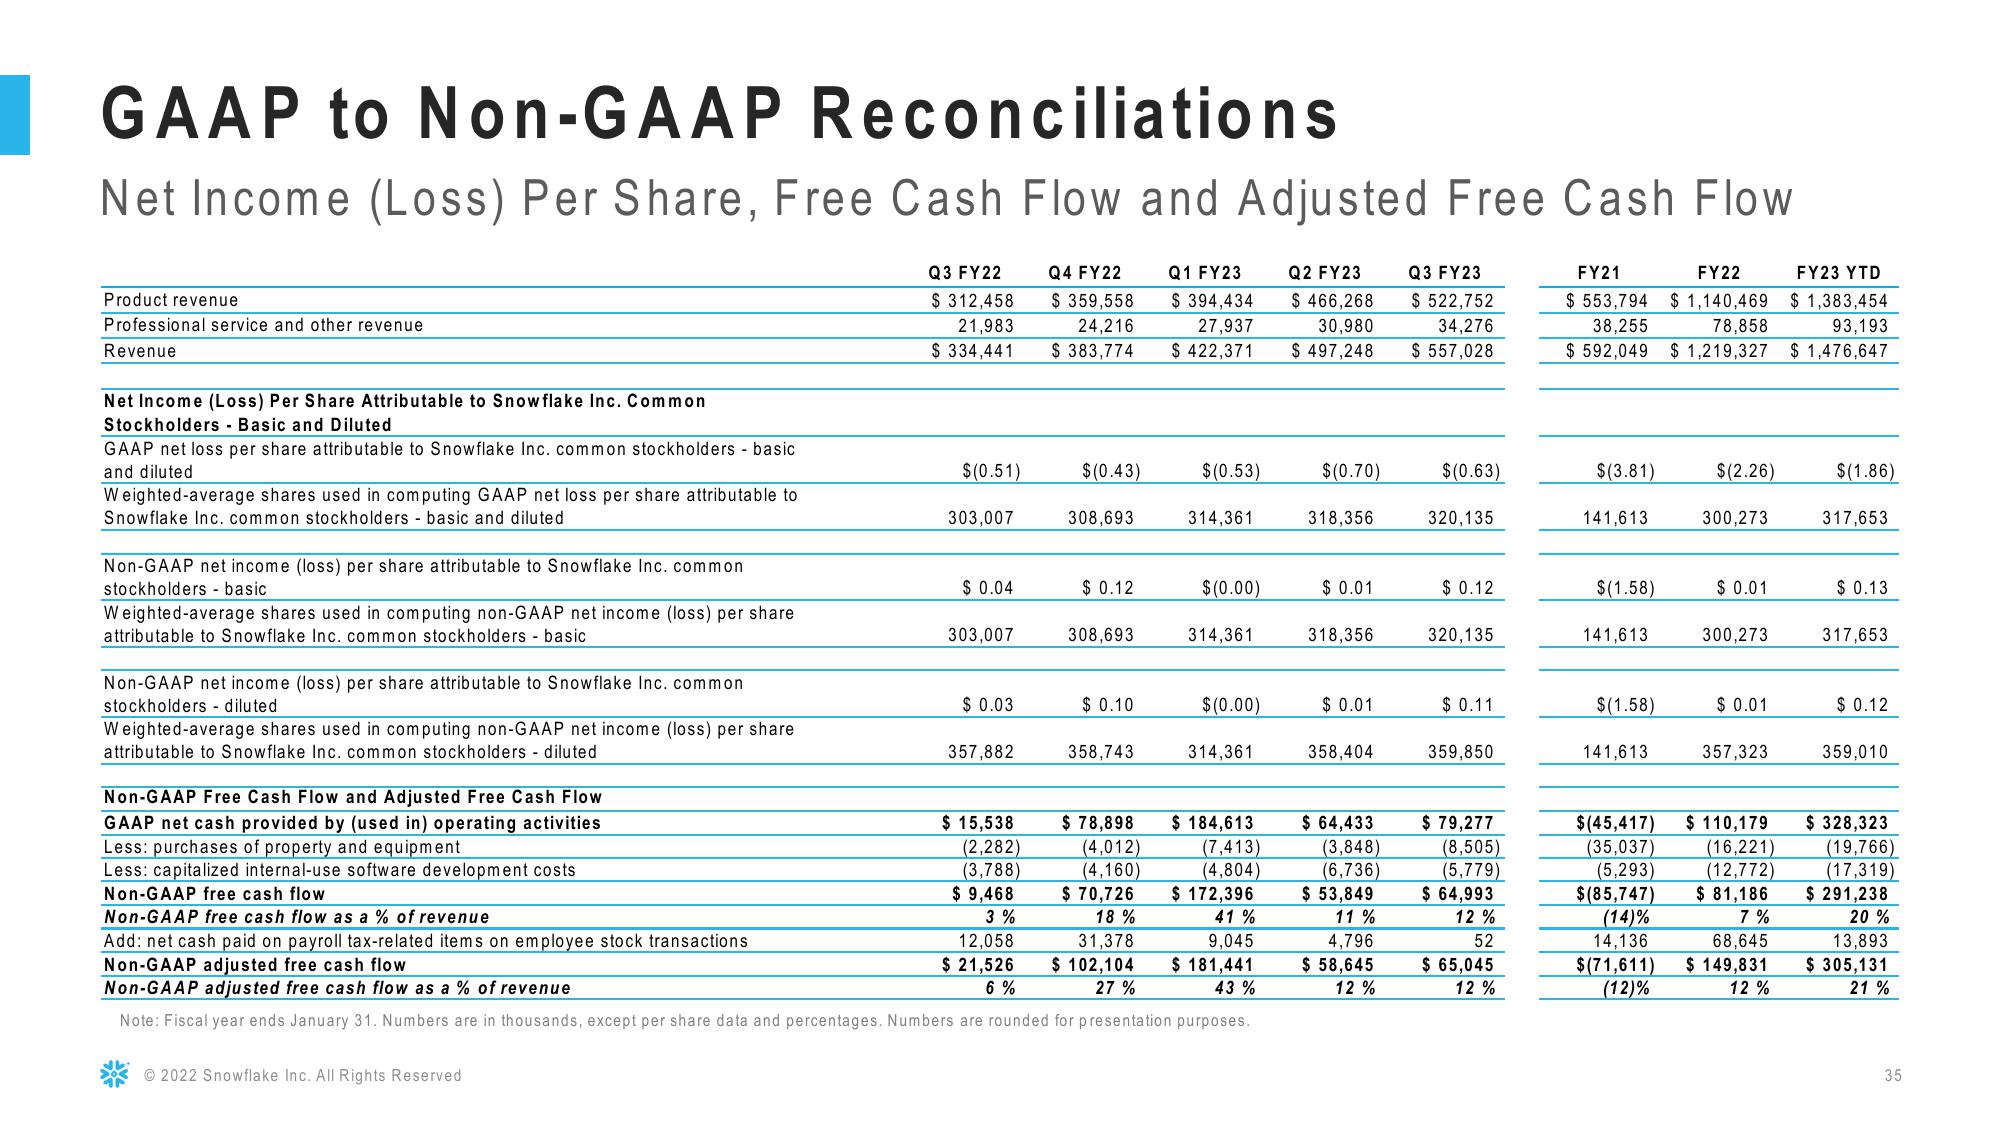
GAAP to Non-GAAP Reconciliations
Net Income (Loss) Per Share, Free Cash Flow and Adjusted Free Cash Flow
Product revenue
Professional service and other revenue
Revenue
Net Income (Loss) Per Share Attributable to Snowflake Inc. Common
Stockholders - Basic and Diluted
GAAP net loss per share attributable to Snowflake Inc. common stockholders - basic
and diluted
Weighted-average shares used in computing GAAP net loss per share attributable to
Snowflake Inc. common stockholders - basic and diluted
Non-GAAP net income (loss) per share attributable to Snowflake Inc. common
stockholders - basic
Weighted-average shares used in computing non-GAAP net income (loss) per share
attributable to Snowflake Inc. common stockholders - basic
Non-GAAP net income (loss) per share attributable to Snowflake Inc. common
stockholders - diluted
Weighted-average shares used in computing non-GAAP net income (loss) per share
attributable to Snowflake Inc. common stockholders - diluted
Q3 FY22
$ 312,458
21,983
$ 334,441
Ⓒ2022 Snowflake Inc. All Rights Reserved
$(0.51)
303,007
$ 0.04
303,007
$ 0.03
357,882
Q4 FY22
$ 359,558
24,216
$ 383,774
$ 15,538
(2,282)
(3,788)
$ 9,468
3%
12,058
$ 21,526
6%
$(0.43)
308,693
$0.12
308,693
$0.10
358,743
$ 78,898
(4,012)
(4,160)
$ 70,726
18%
Q1 FY23
$ 394,434
27,937
$ 422,371
31,378
$ 102,104
27%
$(0.53)
Non-GAAP Free Cash Flow and Adjusted Free Cash Flow
GAAP net cash provided by (used in) operating activities
Less: purchases of property and equipment
Less: capitalized internal-use software development costs
Non-GAAP free cash flow
Non-GAAP free cash flow as a % of revenue
Add: net cash paid on payroll tax-related items on employee stock transactions
Non-GAAP adjusted free cash flow
Non-GAAP adjusted free cash flow as a of revenue
Note: Fiscal year ends January 31. Numbers are in thousands, except per share data and percentages. Numbers are rounded for presentation purposes.
314,361
$(0.00)
314,361
$(0.00)
314,361
$ 184,613
(7,413)
(4,804)
$ 172,396
41%
9,045
$ 181,441
43%
Q2 FY23
$ 466,268
30,980
$ 497,248
$(0.70)
318,356
$0.01
318,356
$ 0.01
358,404
$ 64,433
(3,848)
(6,736)
$ 53,849
11%
4,796
$ 58,645
12%
Q3 FY23
$ 522,752
34,276
$ 557,028
$(0.63)
320,135
$0.12
320,135
$0.11
359,850
$ 79,277
(8,505)
(5,779)
$ 64,993
12%
52
$ 65,045
12%
FY21
FY22
$ 553,794 $ 1,140,469
38,255
78,858
$592,049 $1,219,327
$(3.81)
141,613
$(1.58)
141,613
$(1.58)
141,613
$(45,417)
(35,037)
(5,293)
$(85,747)
(14)%
14,136
$(71,611)
(12)%
$(2.26)
300,273
$ 0.01
300,273
$ 0.01
357,323
$ 110,179
(16,221)
(12,772)
$ 81,186
7%
68,645
$ 149,831
12%
FY23 YTD
$ 1,383,454
93,193
$ 1,476,647
$(1.86)
317,653
$ 0.13
317,653
$0.12
359,010
$ 328,323
(19,766)
(17,319)
$ 291,238
20%
13,893
$ 305,131
21%
35View entire presentation