Sonos Results Presentation Deck
Q4 Financial Summary
Q4 Revenue
$316.3
Reported: -12.0%
CC: -6.6%
4Q22
Americas (63% of sales): +1.9% y/y
EMEA (29% of sales): -33.7% y/y
APAC (8% of sales): -1.6% y/y
Q4 Adjusted EBITDA
-8.1% margin
-$25.6
4Q22
$305.1
Reported: -3.5%
CC: -5.1%
4Q23
Americas (67% of sales): +1.9% y/y
EMEA (27% of sales): -8.8% y/y
APAC (6% of sales): -27.5% y/y
$6.3
2.1% margin
4Q23
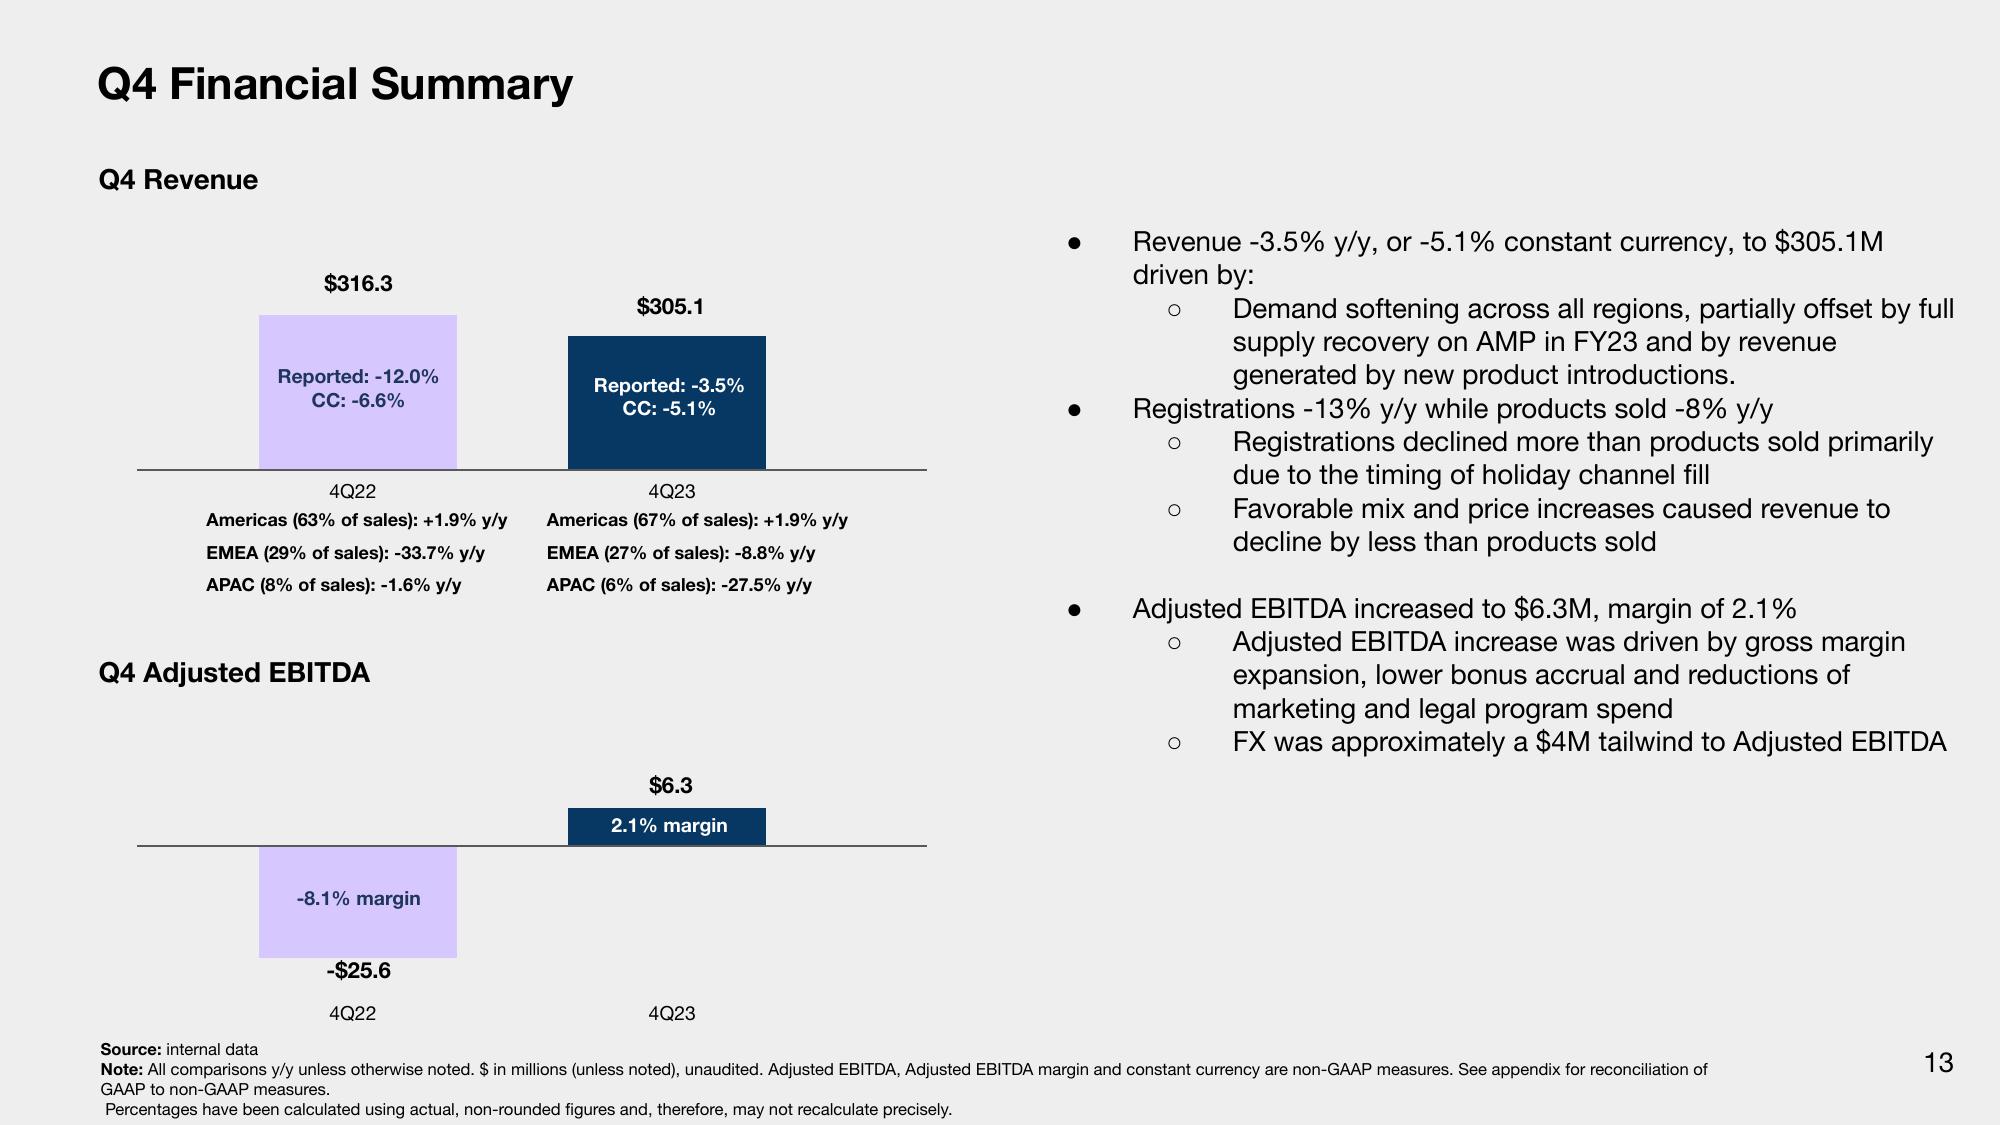
Revenue -3.5% y/y, or -5.1% constant currency, to $305.1M
driven by:
O
Registrations -13% y/y while products sold -8% y/y
O
O
Demand softening across all regions, partially offset by full
supply recovery on AMP in FY23 and by revenue
generated by new product introductions.
O
Registrations declined more than products sold primarily
due to the timing of holiday channel fill
Favorable mix and price increases caused revenue to
decline by less than products sold
Adjusted EBITDA increased to $6.3M, margin of 2.1%
O
Adjusted EBITDA increase was driven by gross margin
expansion, lower bonus accrual and reductions of
marketing and legal program spend
FX was approximately a $4M tailwind to Adjusted EBITDA
Source: internal data
Note: All comparisons y/y unless otherwise noted. $ in millions (unless noted), unaudited. Adjusted EBITDA, Adjusted EBITDA margin and constant currency are non-GAAP measures. See appendix for reconciliation of
GAAP to non-GAAP measures.
Percentages have been calculated using actual, non-rounded figures and, therefore, may not recalculate precisely.
13View entire presentation