Barclays Investment Banking Pitch Book
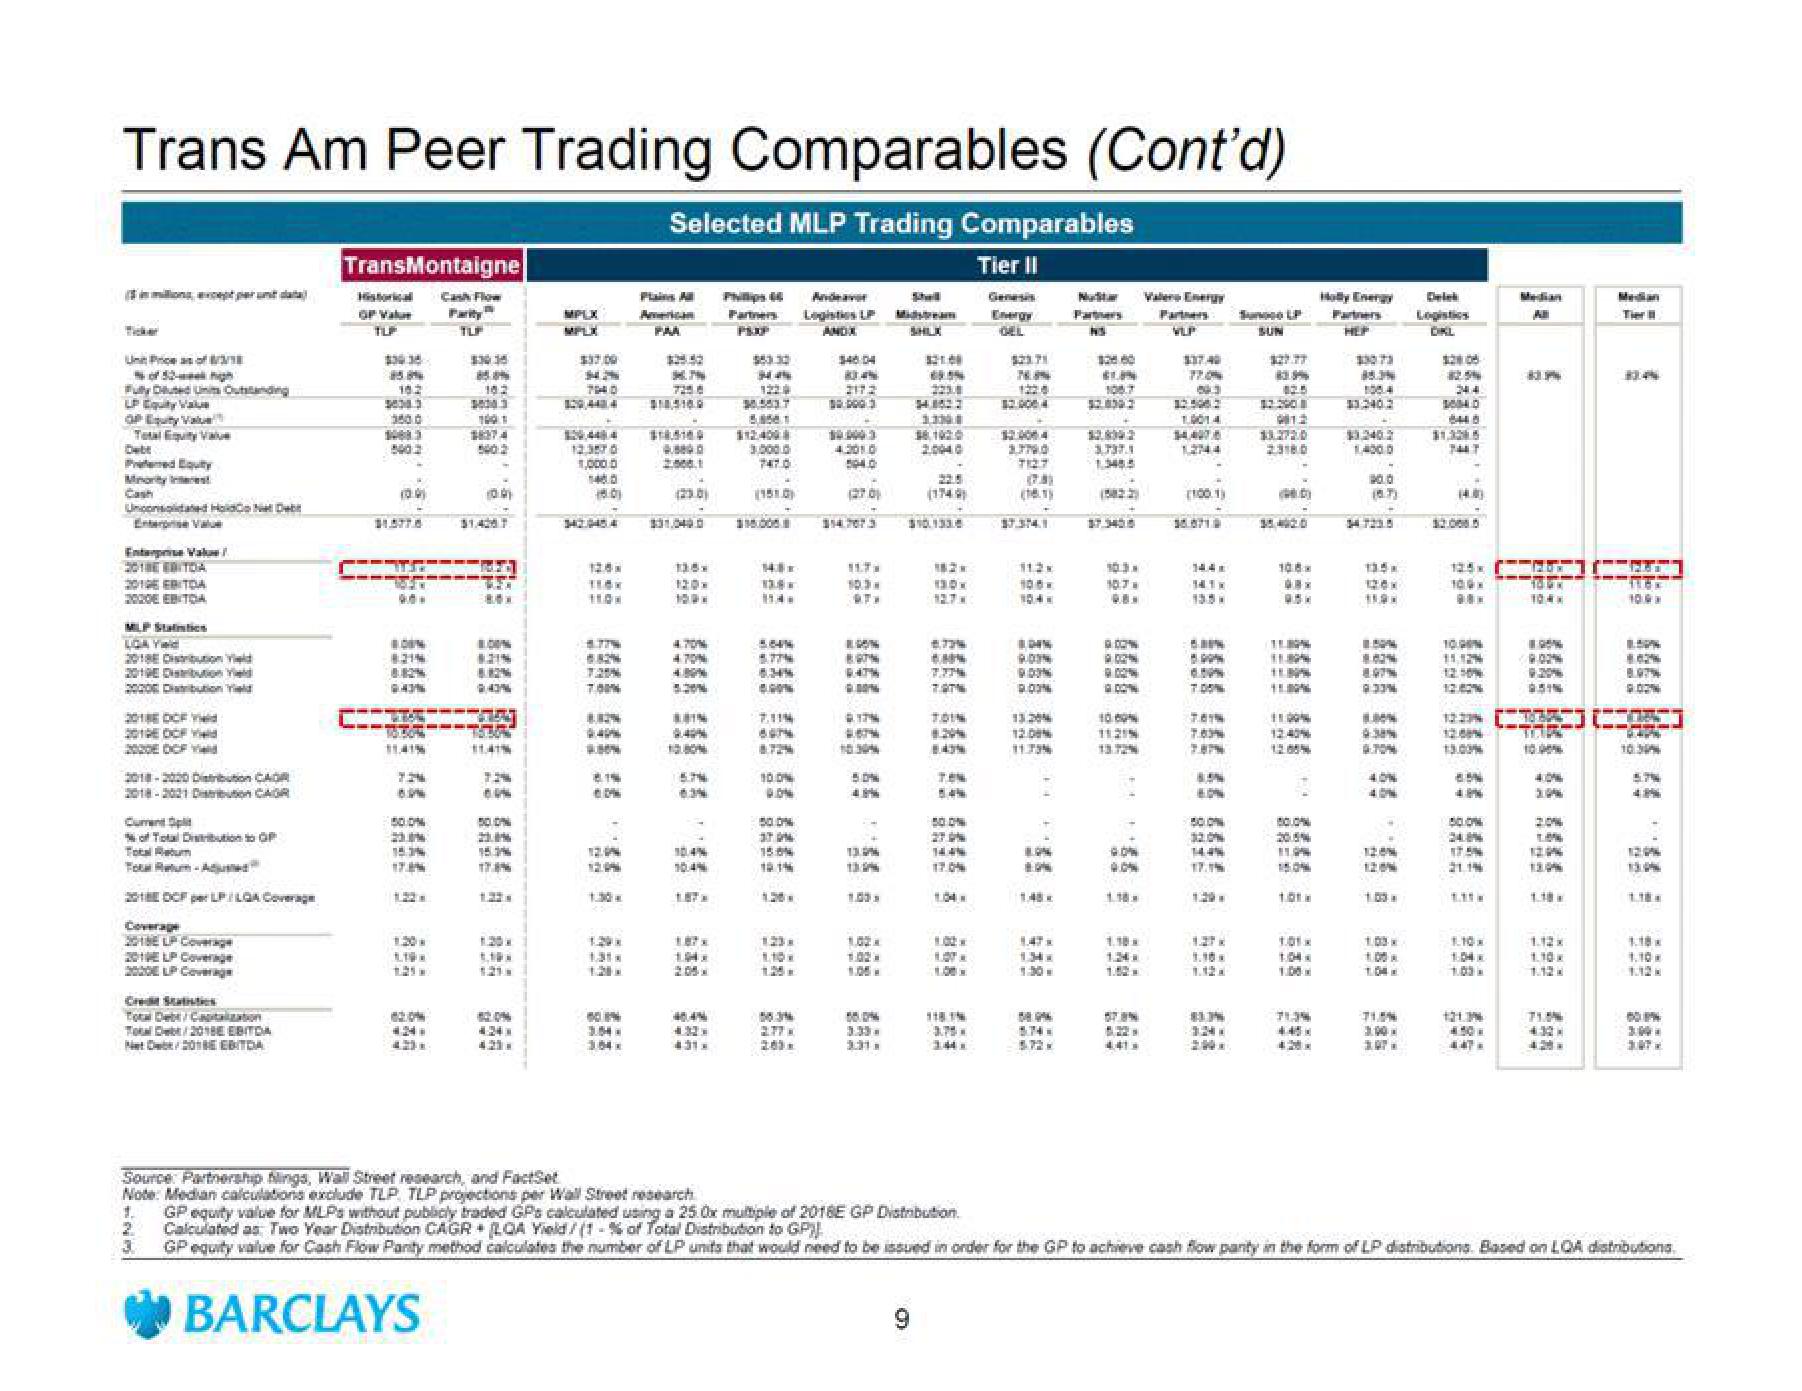
Trans Am Peer Trading Comparables (Cont'd)
Selected MLP Trading Comparables
Tier II
Ticker
of 52-weigh
Fully Duted Uni Outstanding
LP Equity Value
OP Equity Valu
Total Equity Valu
Debt
Preferred Equity
Mority
Uncond Hote
Enterprise Value
Enterprise Value
201 EBITDA
2016 EBITDA
ORDE EBITDA
MLP Static
LGA Yild
2019 Distribution d
3000 Cabution Tield
2016 DOF Yd
2019 DCF d
2018-2020 Distribution CAR
2018-2021 Distribution CAR
Cument Opt
% of Total Distribution to OF
Totaltu
Tour Reum-Austed?
2018 DCF UPLOA Coverage
Coverage
2018ELP Coverage
2010ELP Coverage
CreStatistics
Total Debt Capitalization
T/2018E EBITDA
NO 201 EBITDA
TransMontaigne
Historical Cash Flow
1.
2
3
C
$3934
85.8%
18.2
9438.3
14083
BON
8214
943%
CE
11.41%
7:24
50.0%
17.2%
LIP
1.25 M
130.35
BARCLAYS
18.2
1001
16274
1314
T
50.0%
21.0%
15.3%
17.3%
4:24*
MPLX
MPLX
$37.00
129,443,4
159.4414
12.357 0
1,000.0
18.01
128x
110x
11:00
6.82%
7.00%
80%
80%
P
12.04
12.99
50%
304x
Plains All
PAA
$24.42
725.8
$10.510.0
$14
9.8800
2008.1
4
115
100
4.70%
4.70%
63%
Source: Partnership Slings, Wall Street research, and FactSet
Note: Median calculations exclude TLP TLP projections per Wall Street research
10.4%
10.4%
40.4%
400
431*
Phillips 44
Partners
$53.30
2445
1228
30.583 7
58541
$12.400
3,000.0
747.0
(151.0)
14
13.8.
5.64%
AUTH
8.72%
100%
ON
150 0%
15:0
12:1
1.50
123.
1.10
58.3%
Andeavor
Logistics LP Midstream
ANDA
30.4%
2172
0.0003
10.000 3
504.0
(270)
4
117.
10.3.
BUSTN
10.30%
AN
13.994
1.02.
5.M
2238
34.882 2
13
20040
(1749)
$10.133.8
9
13.0x
**
7.T
TEN
84%
50 0%
14.4%
17.0%
118 T
3.75
3441
Energy
GEL
$23.71
12.0064
3.776.0
7127
(3)
112x
105.
9.OOM
9.00%
13.20
12.0
11.73%
BON
TON
5.72
Partners
NS
$28.00
$2.830.2
12.09.2
3.737.1
1.3485
10.3.
10.7.
CON
1121N
GON
0.0%
124
52,
4.41
Valero Energy
Partners
$37.40
843
1.0014
14.407
1.2744
(1001)
14.4
7.05%
BON
SOLON
32.0%
14.4%
17.1%
1.10
BUN
IN
$27.77
82.5
$3.390
13.272.0
35,402.0
10.8.
48.
11.30%
TUNN
11.00%
11:00
12:40%
11.99
15.0%
104
7139
4.45 K
Holly Energy
100.4
$32402
1.400.0
(8.7)
11.9.
897
8.33%
0.38%
0.70%
1204
1.05
1.03 M
11.00
Delek
$2008
244
10040
$1.325
7447
1400
10.90%
13.00%
BEN
125 GLI
10:0
80.0%
175
21.14
1.10
All
1.03
83%
121.3%
50
447.
122) (4)
-
10:4
10
20%
13.0%
1.18
Median
Tier
1.124
13:44
71.5%
TICK
8.97%
2424
10:30%
5.7%
1.10
1:32 M
GP equity value for MLPs without publicly traded GPs calculated using a 25.0x multiple of 2016E GP Distribution.
Calculated as Two Year Distribution CAGR + LOA Yield/(1-% of Total Distribution to GP
GP equity value for Cash Flow Panty method calculates the number of LP units that would need to be issued in order for the GP to achieve cash flow party in the form of LP distributions. Based on LQA distributions.
50 PMView entire presentation