Third Quarter 2023 Financial Results
THIRD QUARTER FINANCIAL RESULTS
Adjusted Income Statement Highlights
Third Quarter
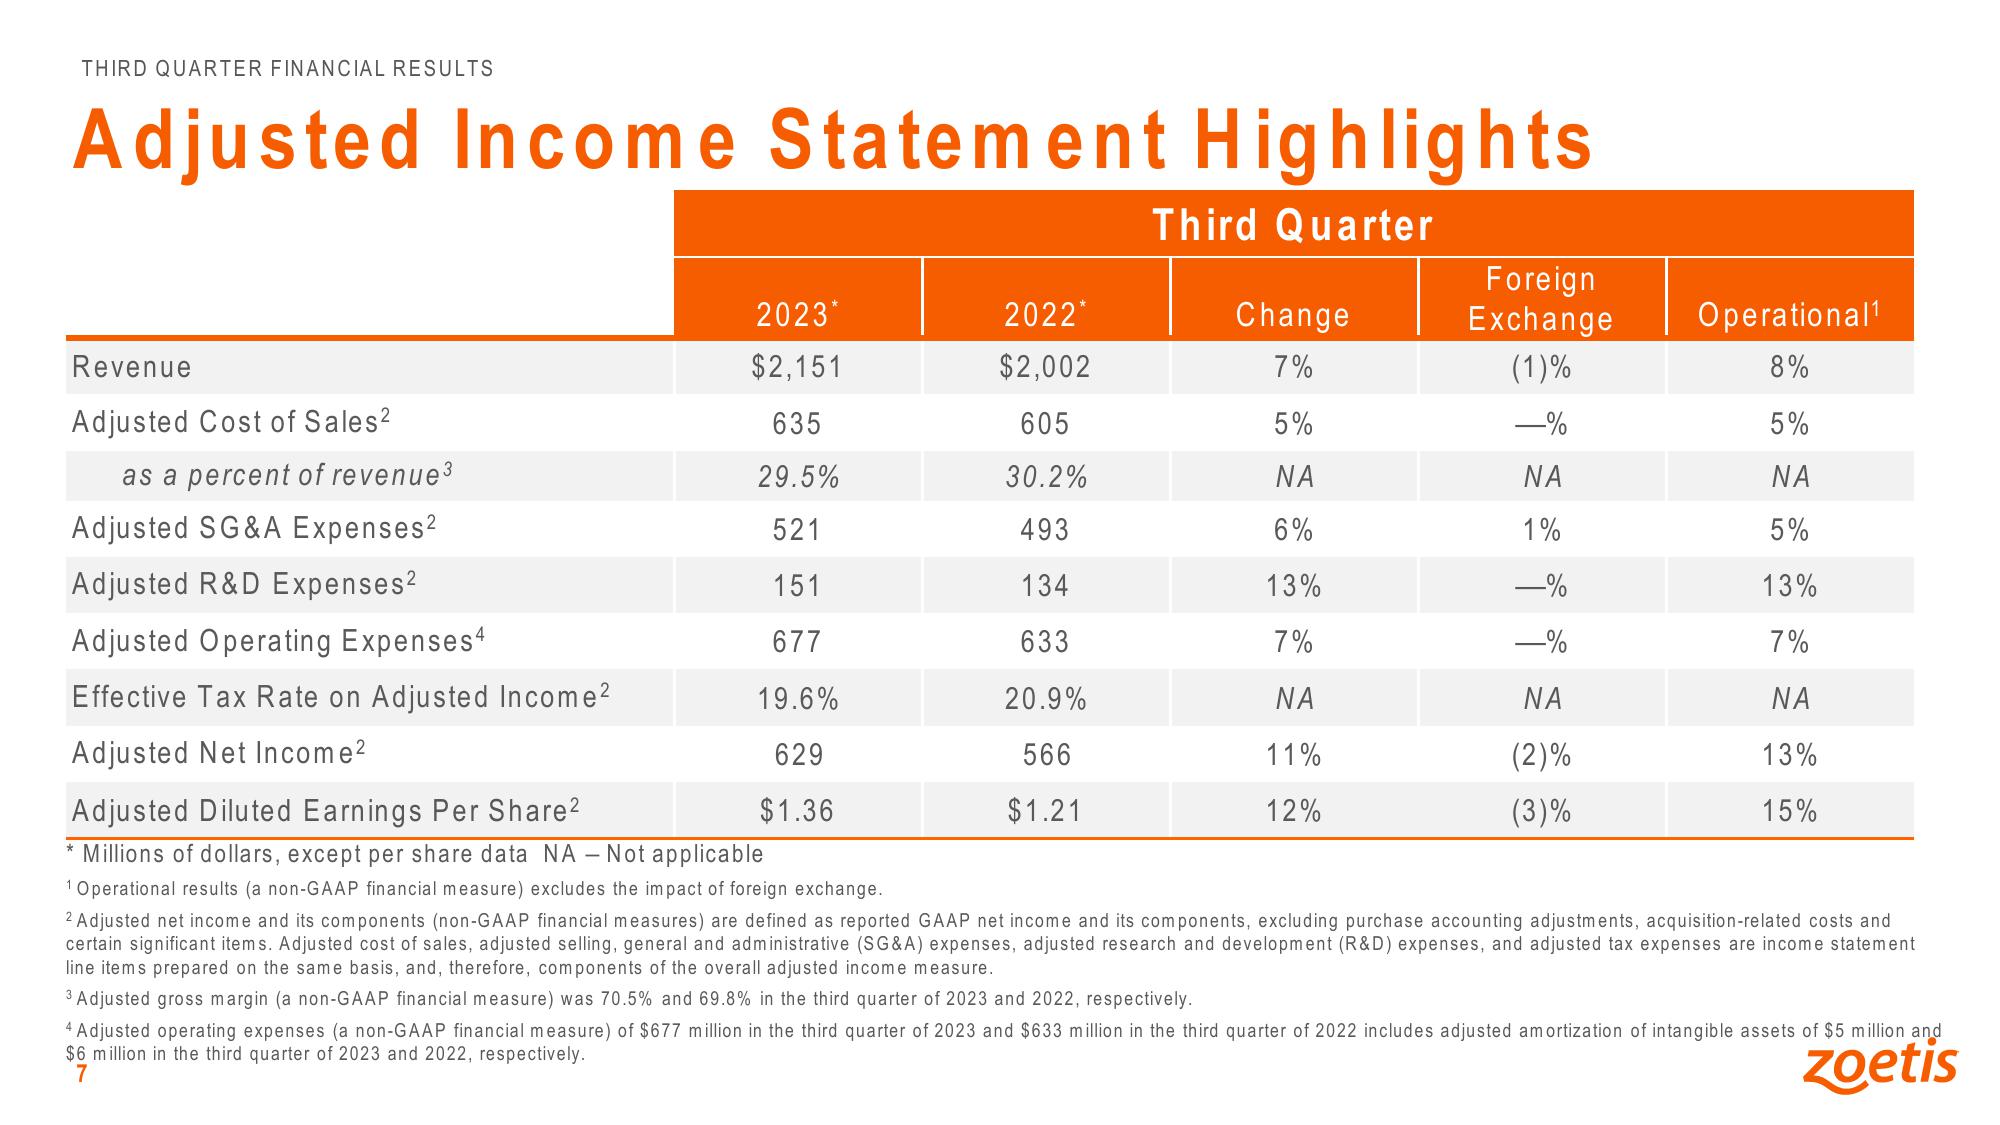
Revenue
Adjusted Cost of Sales²
as a percent of revenue ³
Adjusted SG&A Expenses²
Adjusted R&D Expenses²
Adjusted Operating Expenses4
Effective Tax Rate on Adjusted Income²
Adjusted Net Income²
2023*
$2,151
635
29.5%
521
151
677
19.6%
629
$1.36
2022*
$2,002
605
30.2%
493
134
633
20.9%
566
$1.21
Change
7%
5%
ΝΑ
6%
13%
7%
ΝΑ
11%
12%
Foreign
Exchange
(1)%
-%
ΝΑ
1%
—%
—%
ΝΑ
(2)%
(3)%
Operational¹
8%
5%
ΝΑ
5%
13%
7%
ΝΑ
13%
15%
Adjusted Diluted Earnings Per Share²
* Millions of dollars, except per share data NA - Not applicable
1 Operational results (a non-GAAP financial measure) excludes the impact of foreign exchange.
2 Adjusted net income and its components (non-GAAP financial measures) are defined as reported GAAP net income and its components, excluding purchase accounting adjustments, acquisition-related costs and
certain significant items. Adjusted cost of sales, adjusted selling, general and administrative (SG&A) expenses, adjusted research and development (R&D) expenses, and adjusted tax expenses are income statement
line items prepared on the same basis, and, therefore, components of the overall adjusted income measure.
3 Adjusted gross margin (a non-GAAP financial measure) was 70.5% and 69.8% in the third quarter of 2023 and 2022, respectively.
4 Adjusted operating expenses (a non-GAAP financial measure) of $677 million in the third quarter of 2023 and $633 million in the third quarter of 2022 includes adjusted amortization of intangible assets of $5 million and
$6 million in the third quarter of 2023 and 2022, respectively.
zoetisView entire presentation