SoftBank Results Presentation Deck
SoftBank
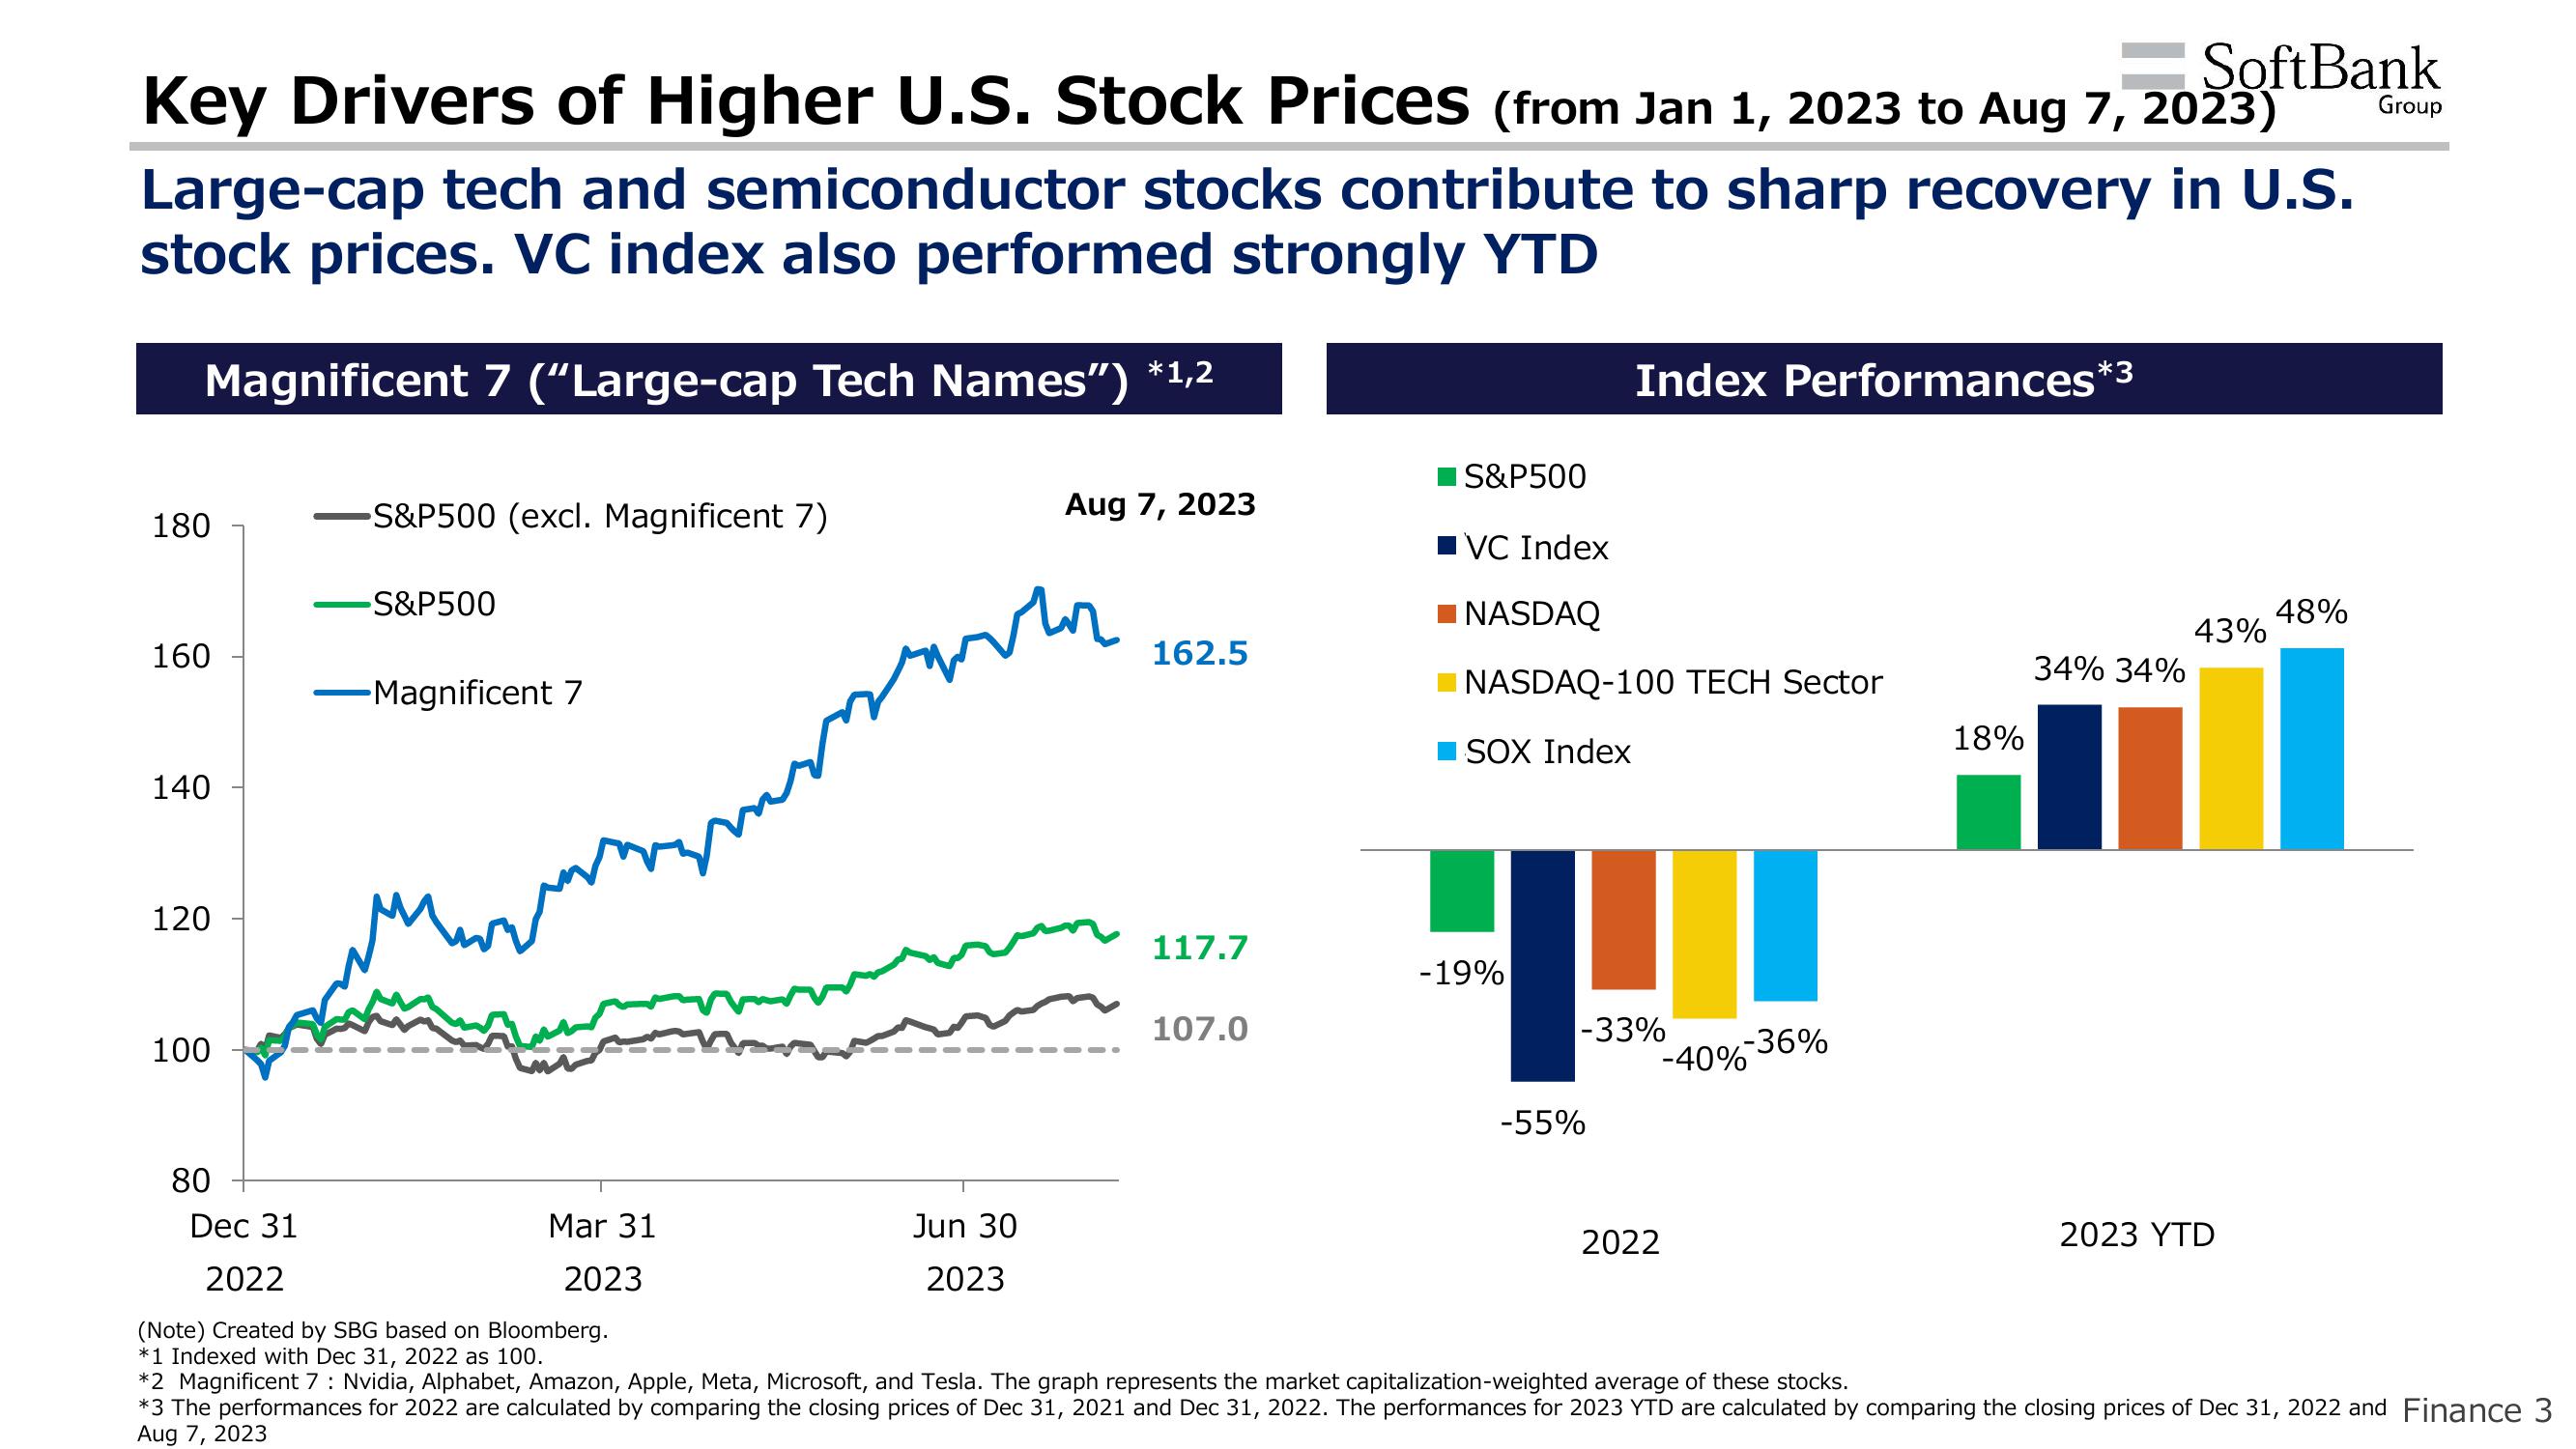
Key Drivers of Higher U.S. Stock Prices (from Jan 1, 2023 to Aug 7, 2023)
Large-cap tech and semiconductor stocks contribute to sharp recovery in U.S.
stock prices. VC index also performed strongly YTD
Magnificent 7 ("Large-cap Tech Names") *1,2
180
160
140
120
100
80
-S&P500 (excl. Magnificent 7)
-S&P500
-Magnificent 7
Mar 31
2023
m
Jun 30
2023
Aug 7, 2023
162.5
117.7
107.0
S&P500
■VC Index
NASDAQ
NASDAQ-100 TECH Sector
SOX Index
- 19%
Index Performances*3
-33%
-55%
-40%-36%
18%
2022
34% 34%
43%
Dec 31
2022
(Note) Created by SBG based on Bloomberg.
*1 Indexed with Dec 31, 2022 as 100.
*2 Magnificent 7: Nvidia, Alphabet, Amazon, Apple, Meta, Microsoft, and Tesla. The graph represents the market capitalization-weighted average of these stocks.
*3 The performances for 2022 are calculated by comparing the closing prices of Dec 31, 2021 and Dec 31, 2022. The performances for 2023 YTD are calculated by comparing the closing prices of Dec 31, 2022 and Finance 3
Aug 7, 2023
48%
2023 YTD
GroupView entire presentation