Grab Results Presentation Deck
Business Update
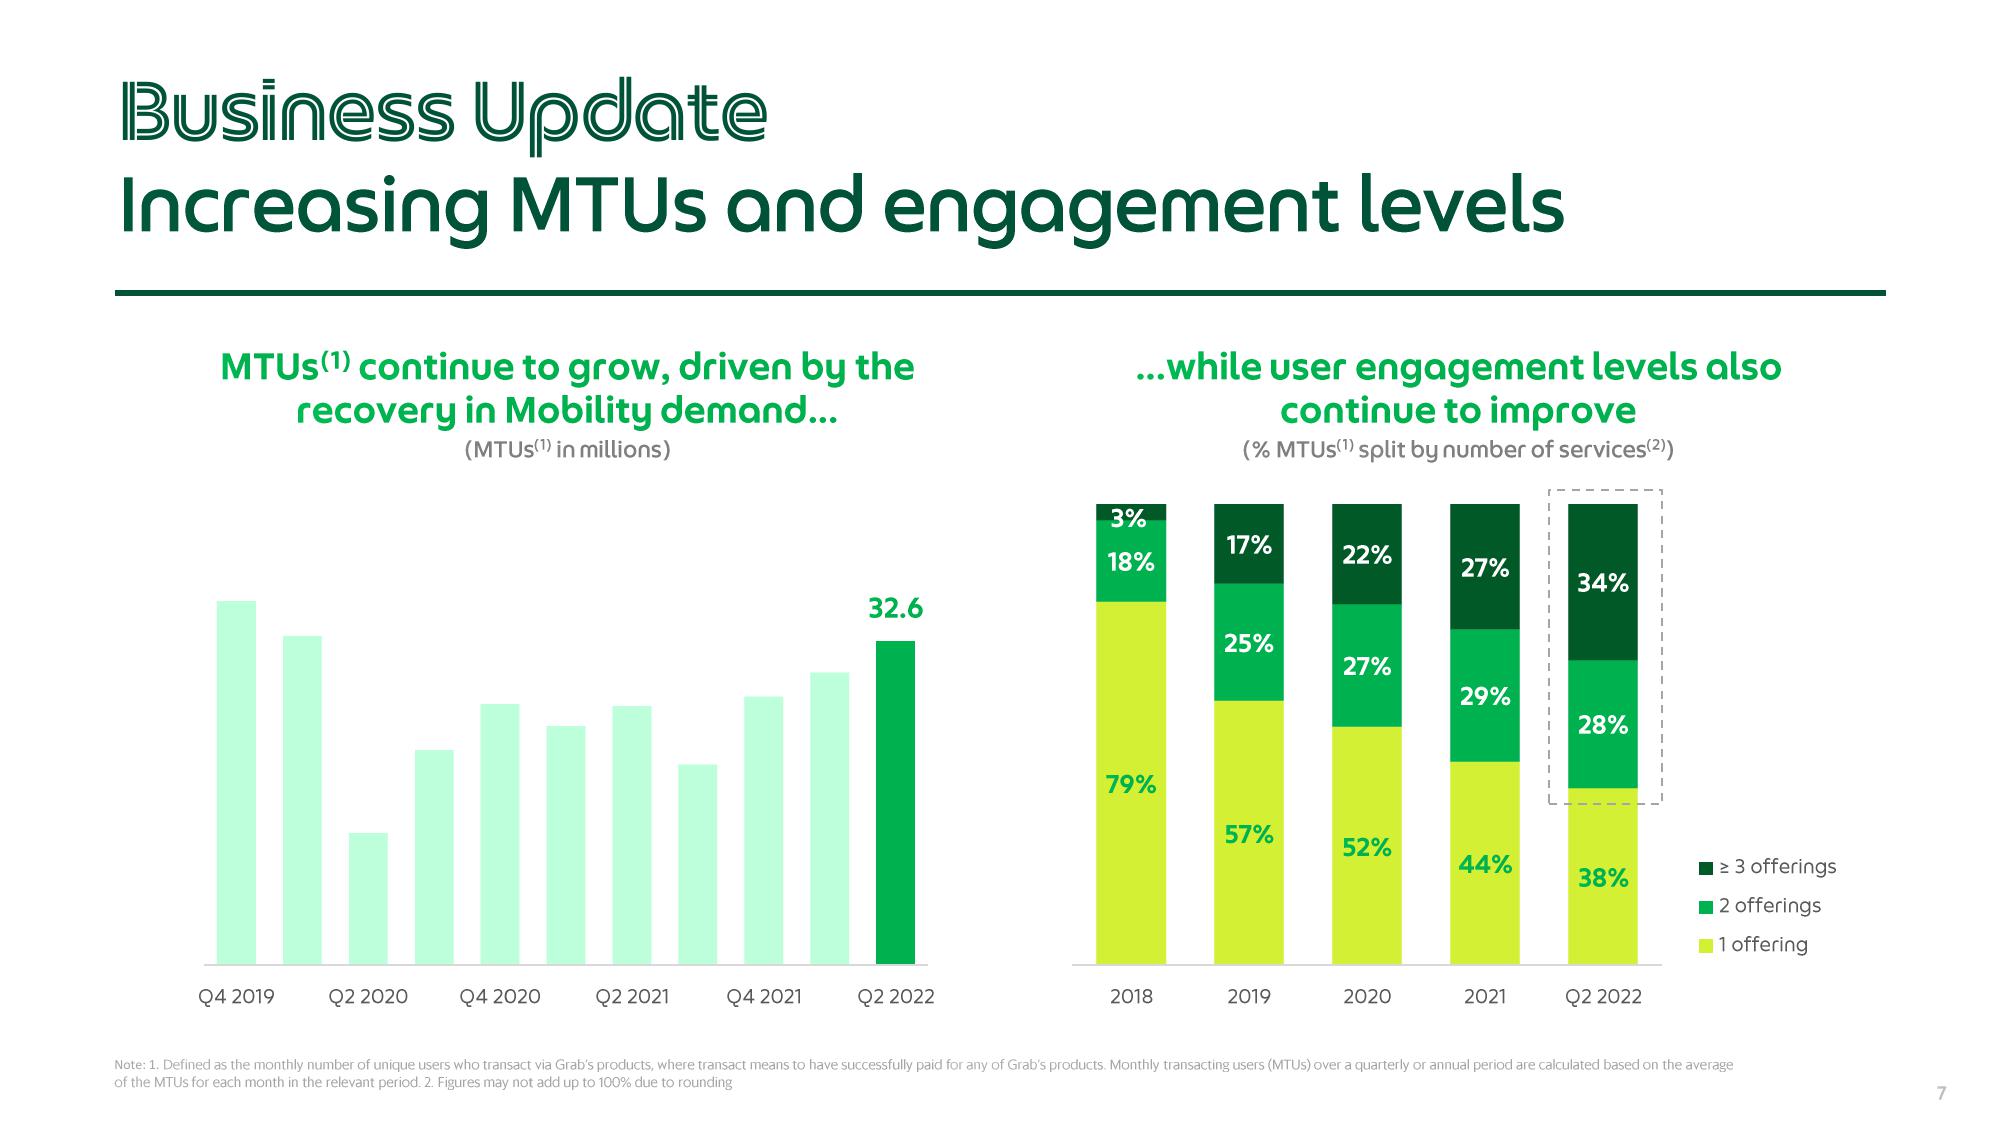
Increasing MTUs and engagement levels
MTUS (¹) continue to grow, driven by the
recovery in Mobility demand...
(MTUS(¹) in millions)
Q4 2019
Q2 2020
Q4 2020
Q2 2021
32.6
TI
Q4 2021
Q2 2022
...while user engagement levels also
continue to improve
(% MTUS(¹) split by number of services (²))
3%
18%
79%
2018
17%
25%
57%
2019
22%
27%
52%
2020
27%
29%
44%
2021
34%
28%
38%
Q2 2022
1 ≥ 3 offerings
■2 offerings
1 offering
Note: 1. Defined as the monthly number of unique users who transact via Grab's products, where transact means to have successfully paid for any of Grab's products. Monthly transacting users (MTUS) over a quarterly or annual period are calculated based on the average
of the MTUs for each month in the relevant period. 2. Figures may not add up to 100% due to rounding
7View entire presentation