Kore Investor Presentation Deck
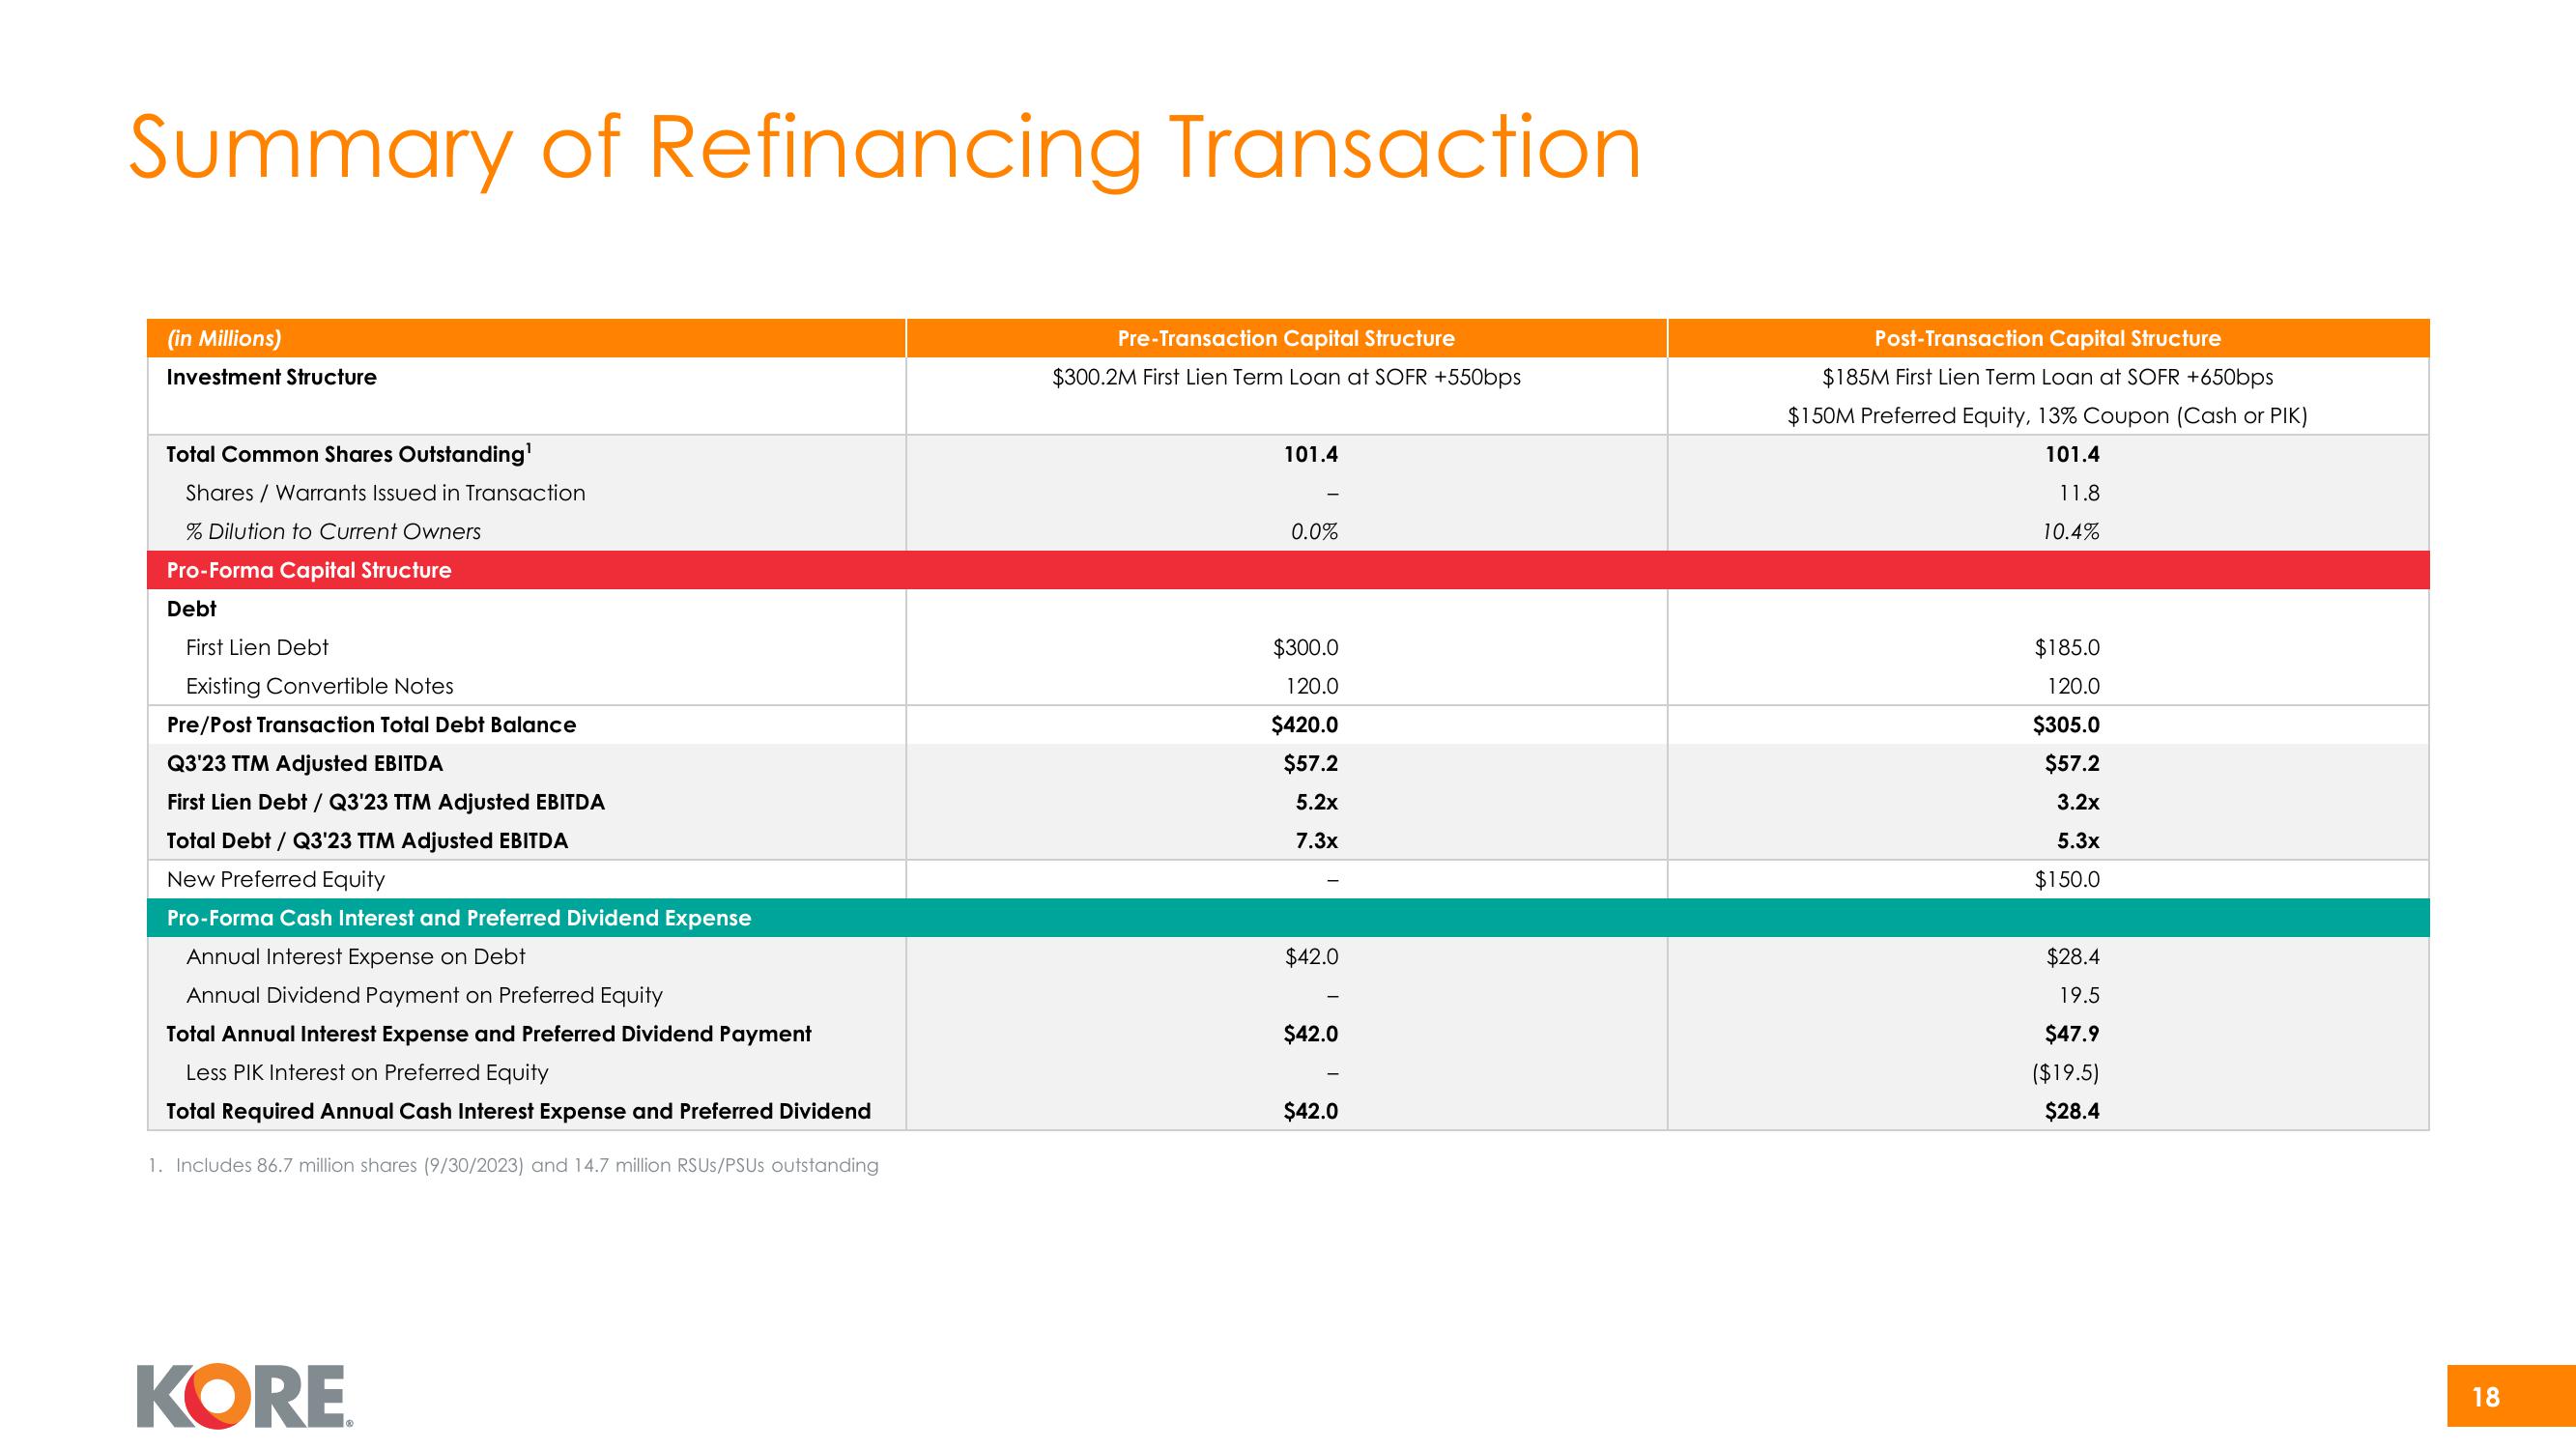
Summary of Refinancing Transaction
(in Millions)
Investment Structure
Total Common Shares Outstanding¹
Shares / Warrants Issued in Transaction
% Dilution to Current Owners
Pro-Forma Capital Structure
Debt
First Lien Debt
Existing Convertible Notes
Pre/Post Transaction Total Debt Balance
Q3'23 TTM Adjusted EBITDA
First Lien Debt / Q3'23 TTM Adjusted EBITDA
Total Debt / Q3'23 TTM Adjusted EBITDA
New Preferred Equity
Pro-Forma Cash Interest and Preferred Dividend Expense
Annual Interest Expense on Debt
Annual Dividend Payment on Preferred Equity
Total Annual Interest Expense and Preferred Dividend Payment
Less PIK Interest on Preferred Equity
Total Required Annual Cash Interest Expense and Preferred Dividend
1. Includes 86.7 million shares (9/30/2023) and 14.7 million RSUS/PSUs outstanding
KORE
Pre-Transaction Capital Structure
$300.2M First Lien Term Loan at SOFR +550bps
101.4
0.0%
$300.0
120.0
$420.0
$57.2
5.2x
7.3x
$42.0
$42.0
$42.0
Post-Transaction Capital Structure
$185M First Lien Term Loan at SOFR +650bps
$150M Preferred Equity, 13% Coupon (Cash or PIK)
101.4
11.8
10.4%
$185.0
120.0
$305.0
$57.2
3.2x
5.3x
$150.0
$28.4
19.5
$47.9
($19.5)
$28.4
18View entire presentation