DigitalOcean Results Presentation Deck
ņ Customer Concentration, Revenue Contribution and Growth
Jun 2023
100%
75%
50%
25%
0%
16K
616K
134K
466K
Customers
Testers
Learners
Builders
$57M
$31M
$18M
$7M
Monthly Revenue
Scalers
$1M
(figures as of
Jun-23)
Total¹
Scalers
Builders
Learners
Customer
Growth² %
y-o-y
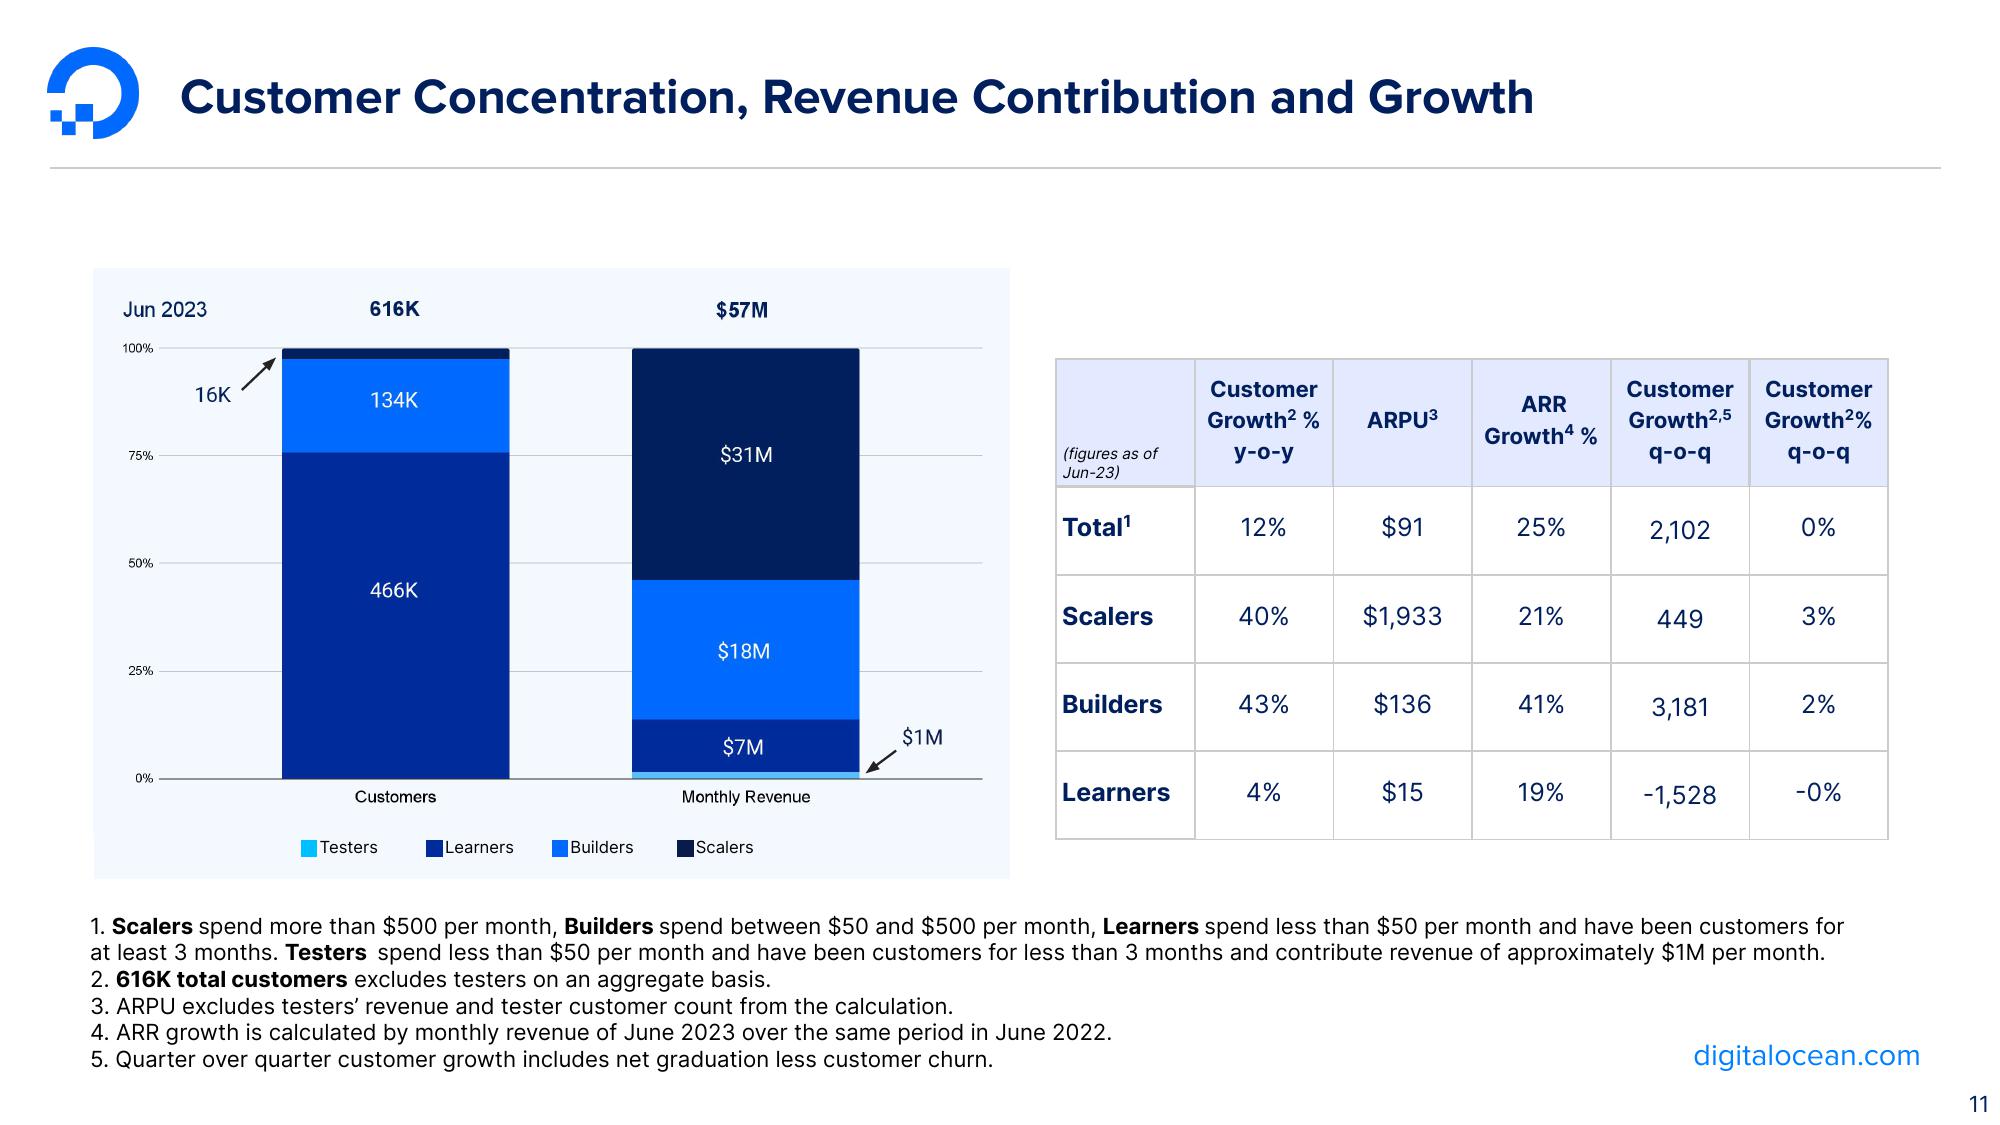
4. ARR growth is calculated by monthly revenue of June 2023 over the same period in June 2022.
5. Quarter over quarter customer growth includes net graduation less customer churn.
12%
40%
43%
4%
ARPU³
$91
$1,933
$136
$15
ARR
Growth4 %
25%
21%
41%
19%
Customer
Growth2,5
q-o-q
2,102
449
3,181
-1,528
Customer
Growth²%
q-o-q
0%
3%
2%
-0%
1. Scalers spend more than $500 per month, Builders spend between $50 and $500 per month, Learners spend less than $50 per month and have been customers for
at least 3 months. Testers spend less than $50 per month and have been customers for less than 3 months and contribute revenue of approximately $1M per month.
2. 616K total customers excludes testers on an aggregate basis.
3. ARPU excludes testers' revenue and tester customer count from the calculation.
digitalocean.com
11View entire presentation