Bank of America Results Presentation Deck
Asset Quality
Net Charge-offs ($MM)¹
$800
$600
$400
$200
$0
$1,000
$500
$0
($500)
($1,000)
$463
ill
0.20%
3Q21
($624)
$362
Provision (Benefit) for Credit Losses ($MM)
3Q21
0.15%
$392
($489)
0.16%
4Q21
1Q22
4Q21
2Q22
Net charge-offs Net charge-off ratio
$571
$30
0.23%
1Q22
$523
$520
2Q22
0.20%
3Q22
0.50%
0.40%
0.30%
0.20%
0.10%
0.00%
$898
3Q22
.
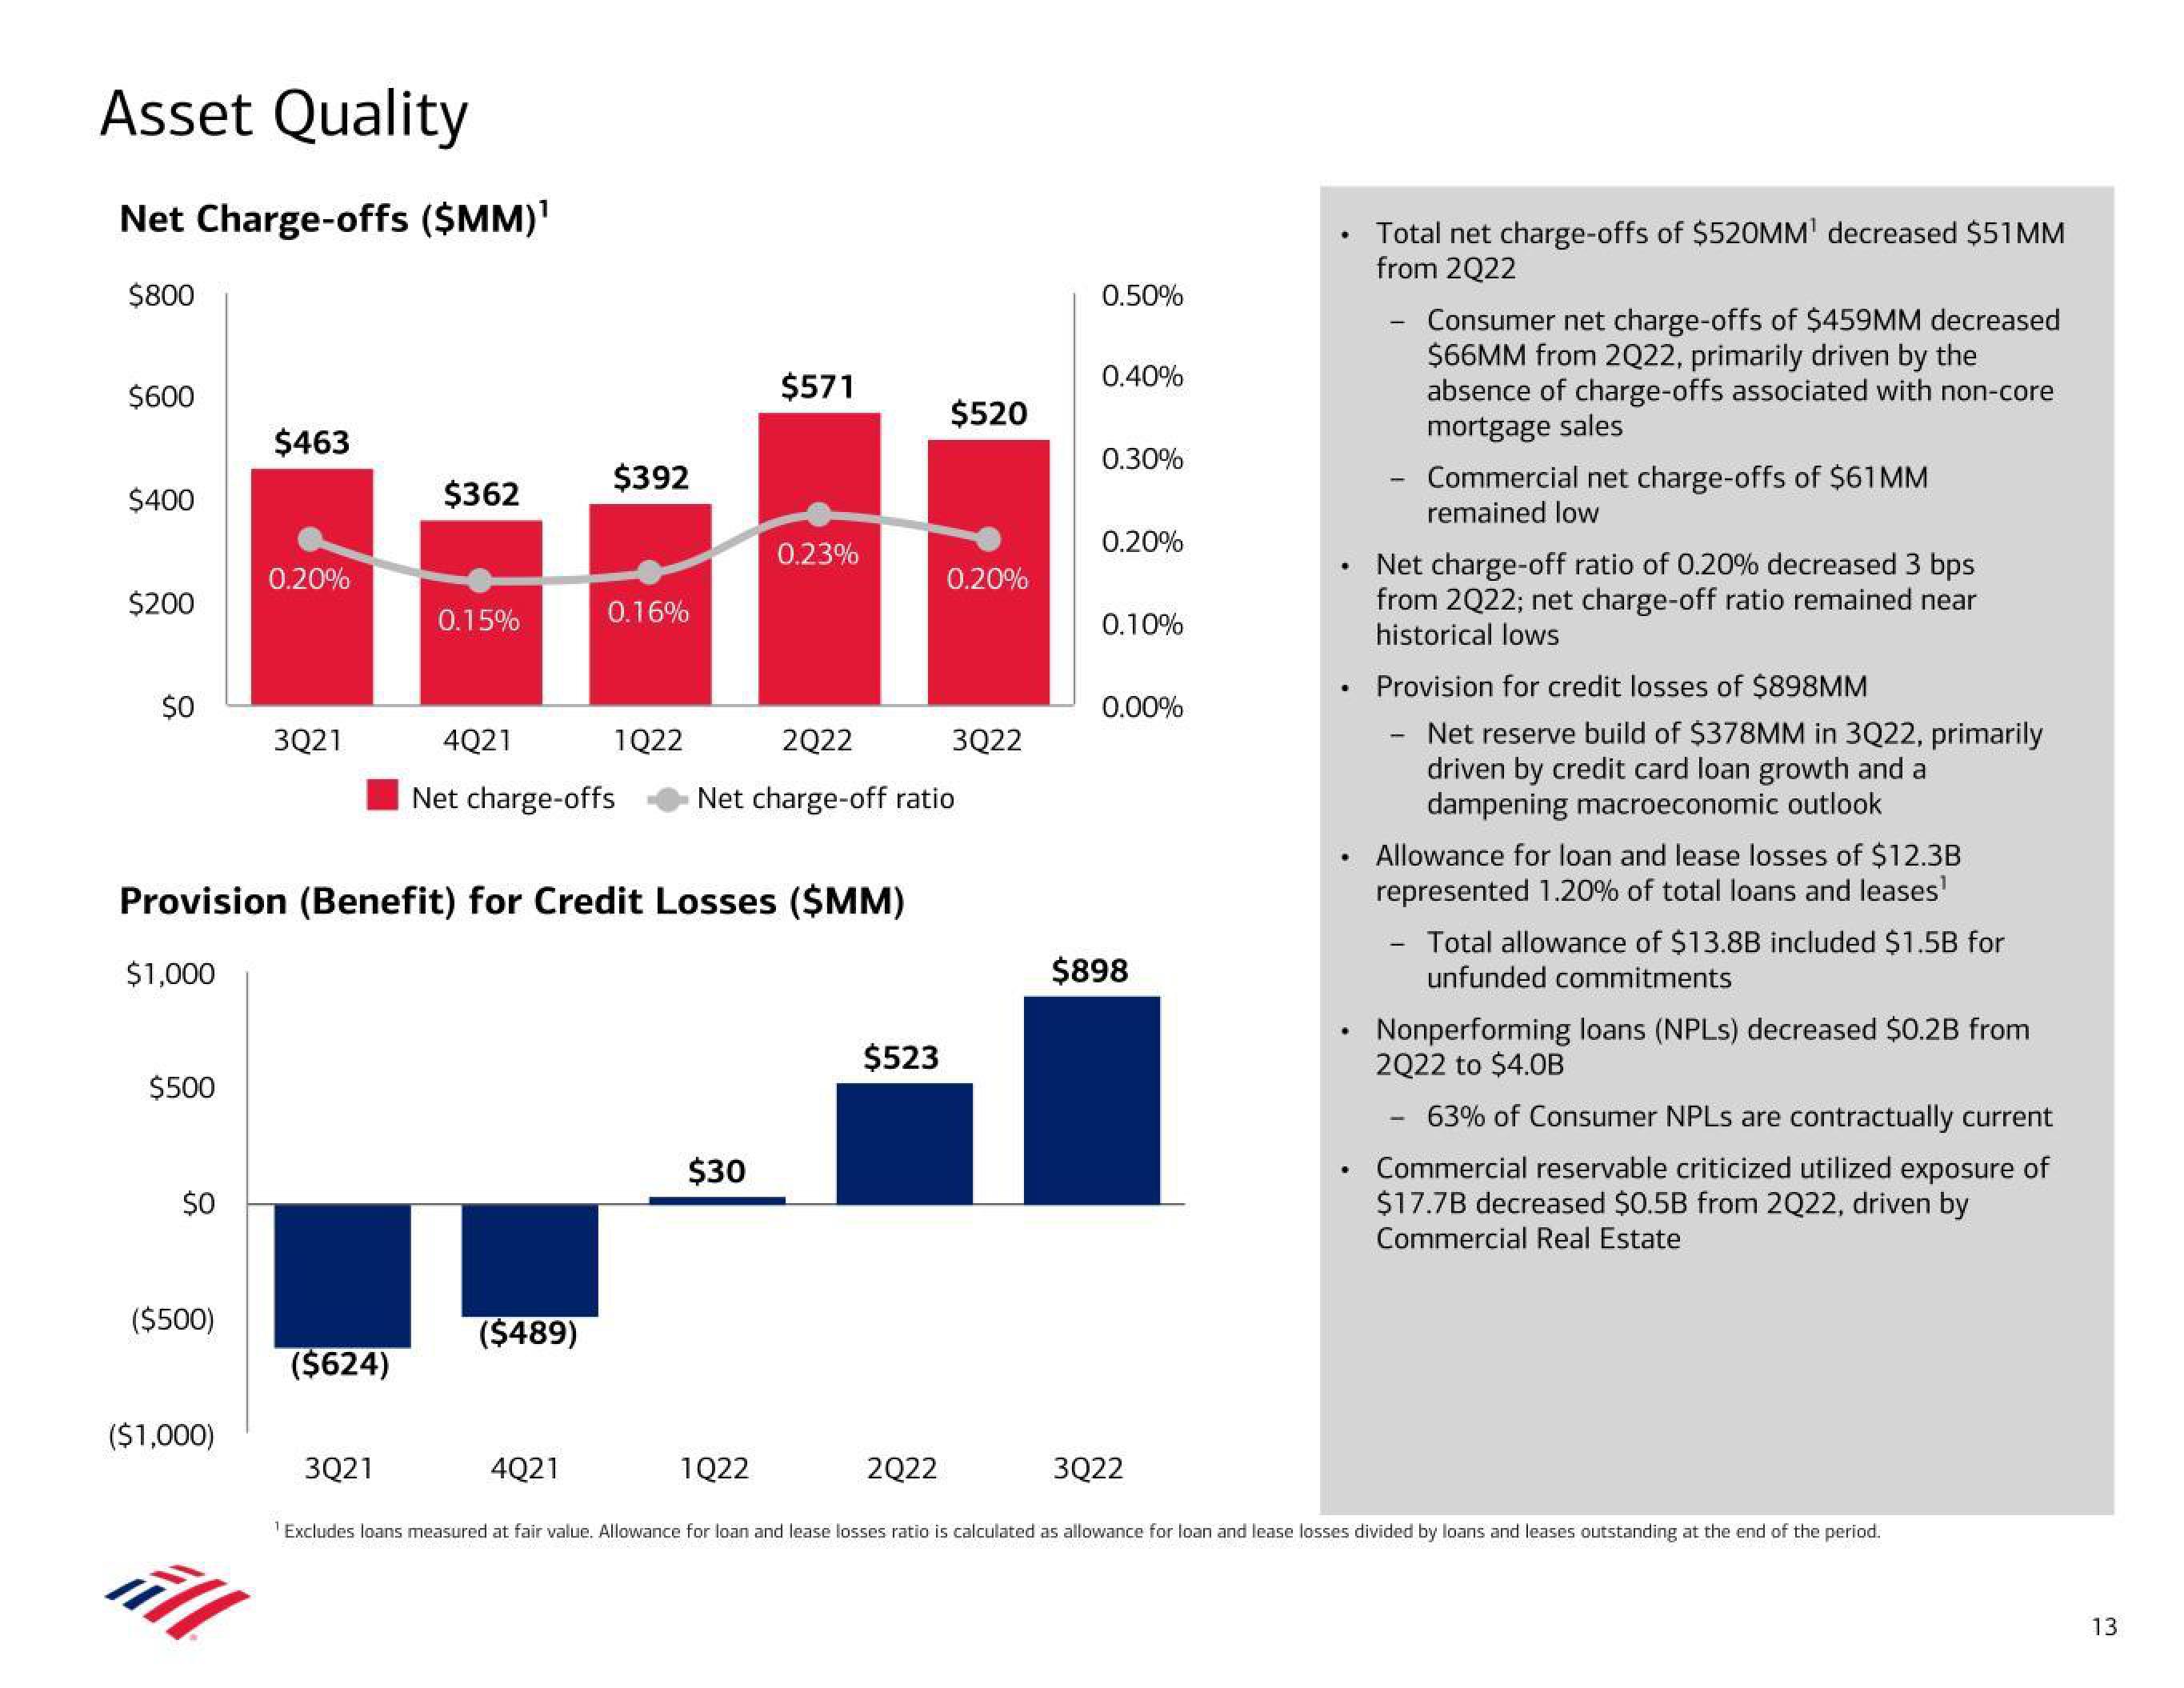
Total net charge-offs of $520MM¹ decreased $51MM
from 2022
-
Consumer net charge-offs of $459MM decreased
$66MM from 2Q22, primarily driven by the
absence of charge-offs associated with non-core
mortgage sales
Net charge-off ratio of 0.20% decreased 3 bps
from 2022; net charge-off ratio remained near
historical lows
-
Commercial net charge-offs of $61MM
remained low
Provision for credit losses of $898MM
Net reserve build of $378MM in 3Q22, primarily
driven by credit card loan growth and a
dampening macroeconomic outlook
-
Allowance for loan and lease losses of $12.3B
represented 1.20% of total loans and leases¹
Total allowance of $13.8B included $1.5B for
unfunded commitments
Nonperforming loans (NPLs) decreased $0.2B from
2Q22 to $4.0B
- 63% of Consumer NPLs are contractually current
Commercial reservable criticized utilized exposure of
$17.7B decreased $0.5B from 2022, driven by
Commercial Real Estate
¹Excludes loans measured at fair value. Allowance for loan and lease losses ratio is calculated as allowance for loan and lease losses divided by loans and leases outstanding at the end of the period.
13View entire presentation