Roblox Results Presentation Deck
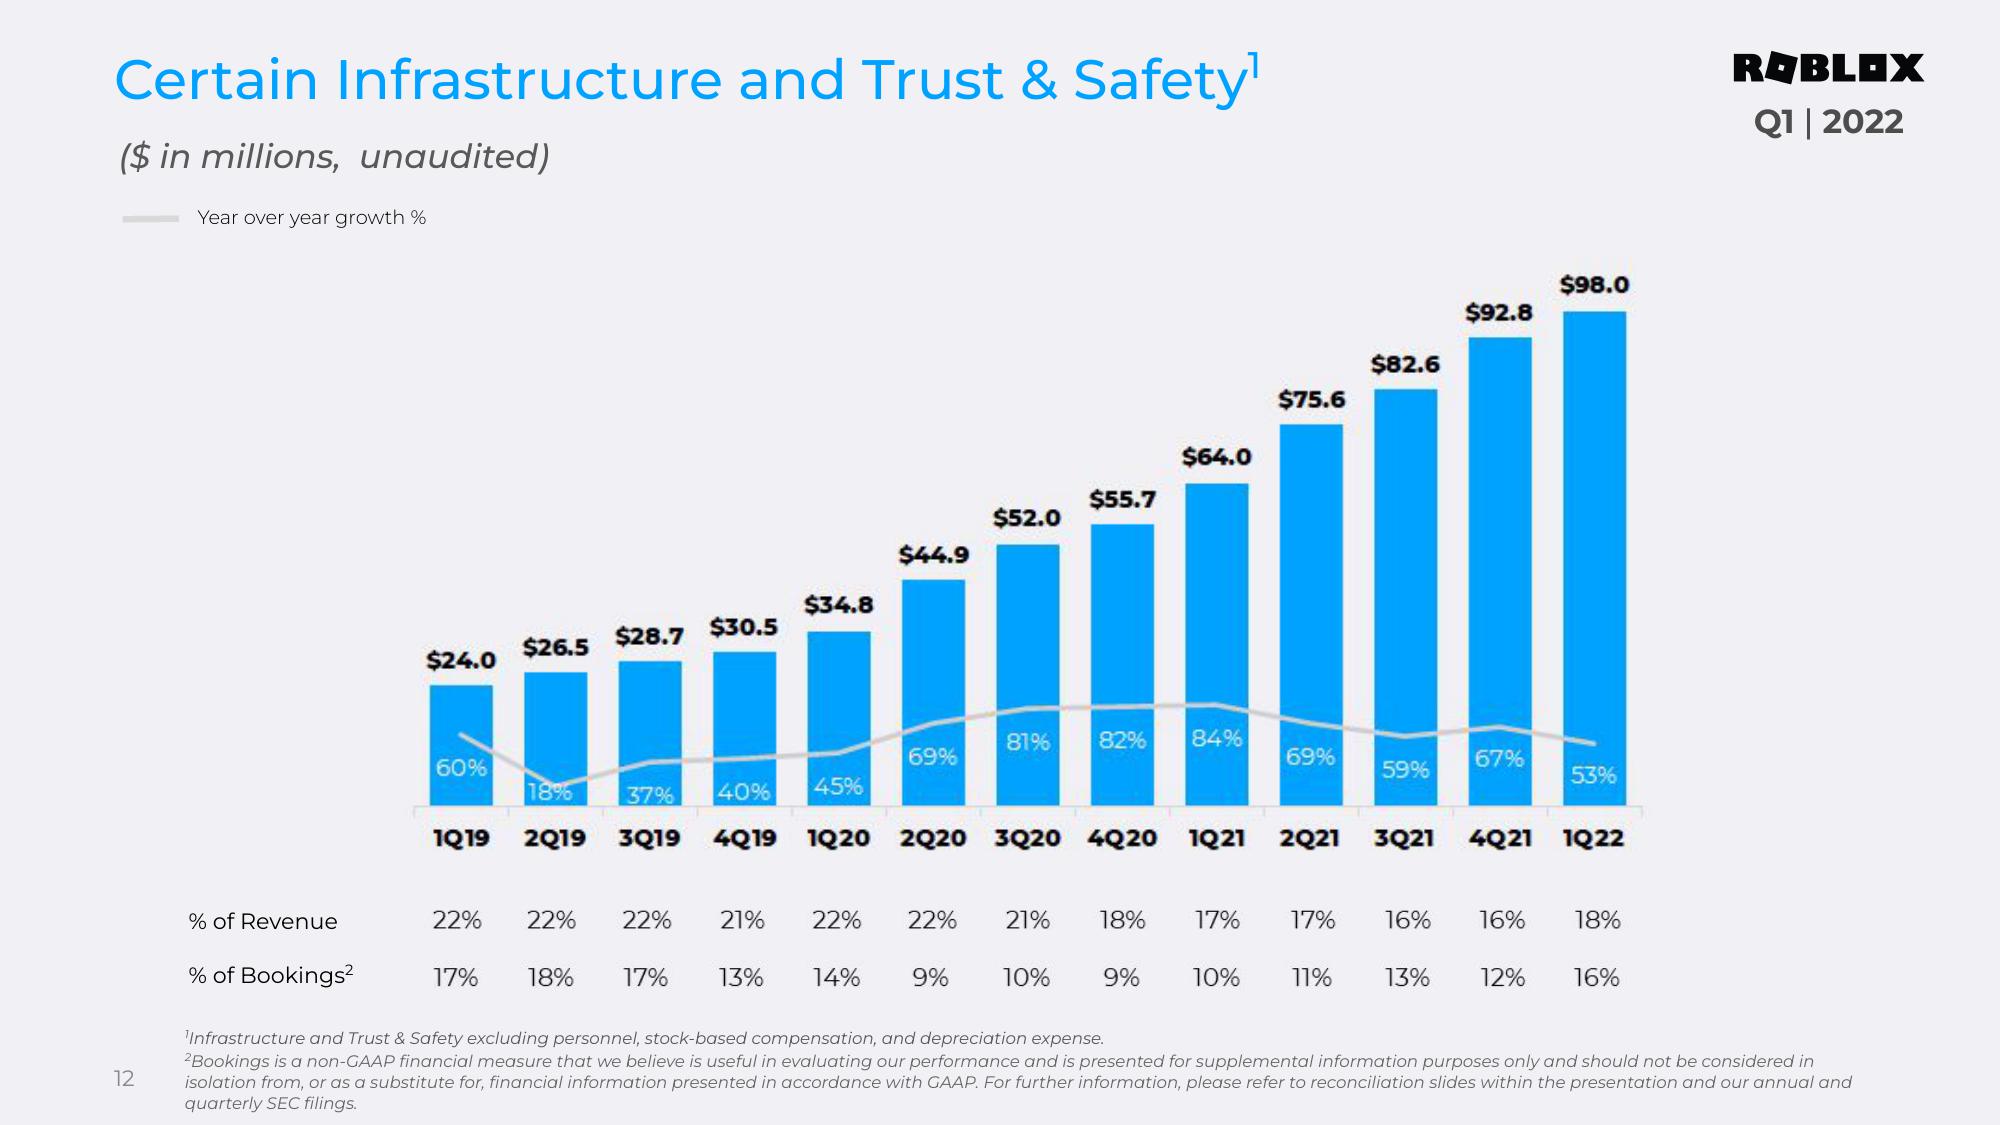
Certain Infrastructure and Trust & Safety¹
($ in millions, unaudited)
Year over year growth %
12
% of Revenue
% of Bookings²
$24.0
60%
$26.5
22%
22%
$28.7
17% 18%
$30.5
22%
$34.8
21%
$44.9
69%
18% 37%
45%
40%
1Q19 2019 3Q19 4Q19 1020 2020 3020 4020 1Q21
17% 13% 14%
22% 22%
$52.0
9%
81%
$55.7
$64.0
82% 84%
$75.6
10% 9% 10%
69%
2Q21
21% 18% 17% 17%
11%
$82.6
59%
$92.8
67%
13%
$98.0
3Q21 4Q21 1Q22
53%
16% 16% 18%
12%
16%
ROBLOX
Q1 2022
'Infrastructure and Trust & Safety excluding personnel, stock-based compensation, and depreciation expense.
2Bookings is a non-GAAP financial measure that we believe is useful in evaluating our performance and is presented for supplemental information purposes only and should not be considered in
isolation from, or as a substitute for, financial information presented in accordance with GAAP. For further information, please refer to reconciliation slides within the presentation and our annual and
quarterly SEC filings.View entire presentation