BuzzFeed SPAC Presentation Deck
BuzzFeed
24.6%
BuzzFeed
18.0%
Comparable Company Benchmarking Analysis
BuzzFeed
Digital Media, Content & Commerce
Mean: 18.5%
Median: 16.7%
26.3%
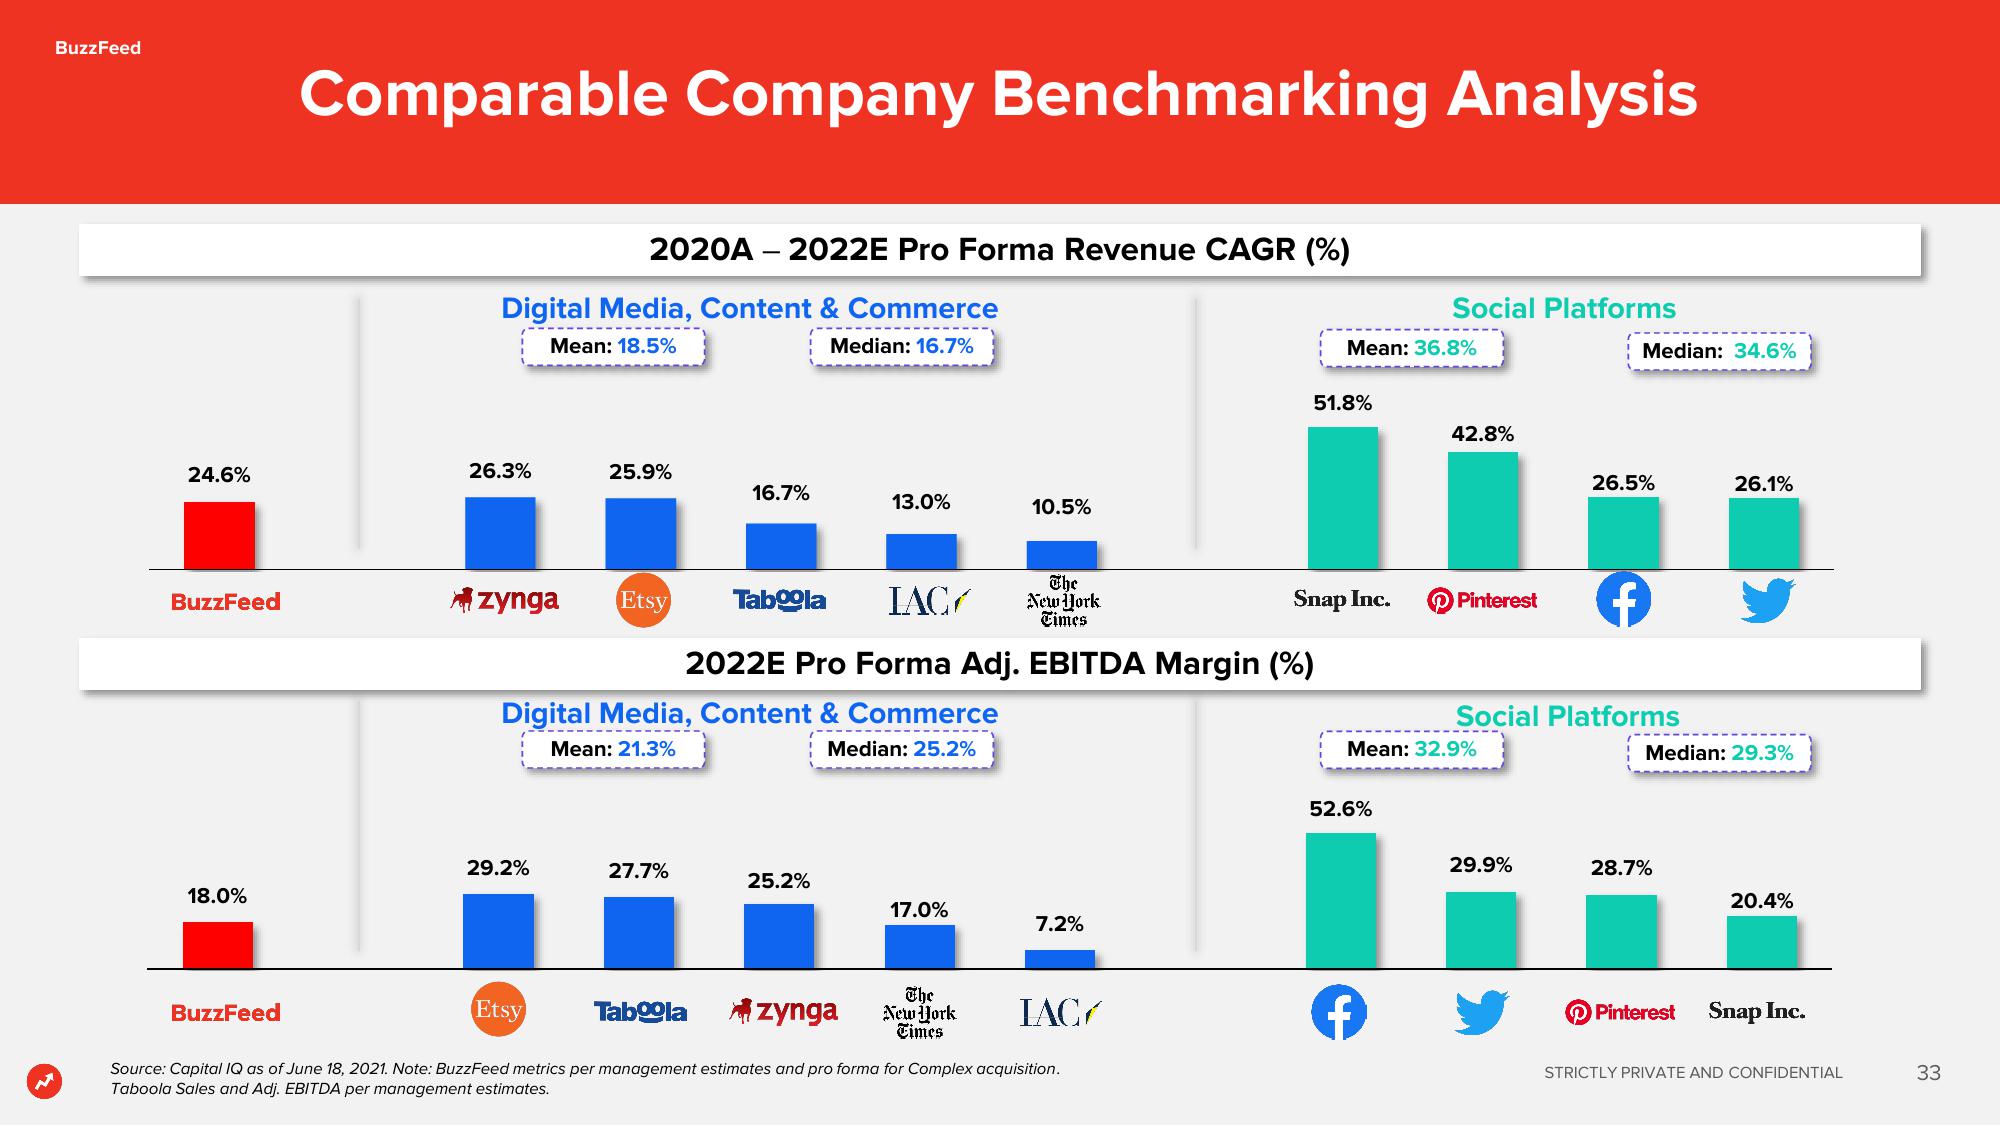
2020A - 2022E Pro Forma Revenue CAGR (%)
zynga Etsy
29.2%
25.9%
Etsy
16.7%
Digital Media, Content & Commerce
Mean: 21.3%
Median: 25.2%
27.7%
13.0%
25.2%
Taboola IAC
2022E Pro Forma Adj. EBITDA Margin (%)
17.0%
10.5%
The
New York
Times
The
New York
Times
Taboola
zynga
IAC
Source: Capital IQ as of June 18, 2021. Note: BuzzFeed metrics per management estimates and pro forma for Complex acquisition.
Taboola Sales and Adj. EBITDA per management estimates.
7.2%
51.8%
Mean: 36.8%
Snap Inc.
Social Platforms
52.6%
f
42.8%
Mean: 32.9%
Median: 34.6%
Pinterest f
26.5%
Social Platforms
29.9%
Median: 29.3%
28.7%
26.1%
Pinterest
20.4%
Snap Inc.
STRICTLY PRIVATE AND CONFIDENTIAL
33View entire presentation