TradeStation SPAC Presentation Deck
% of
Rev.
29
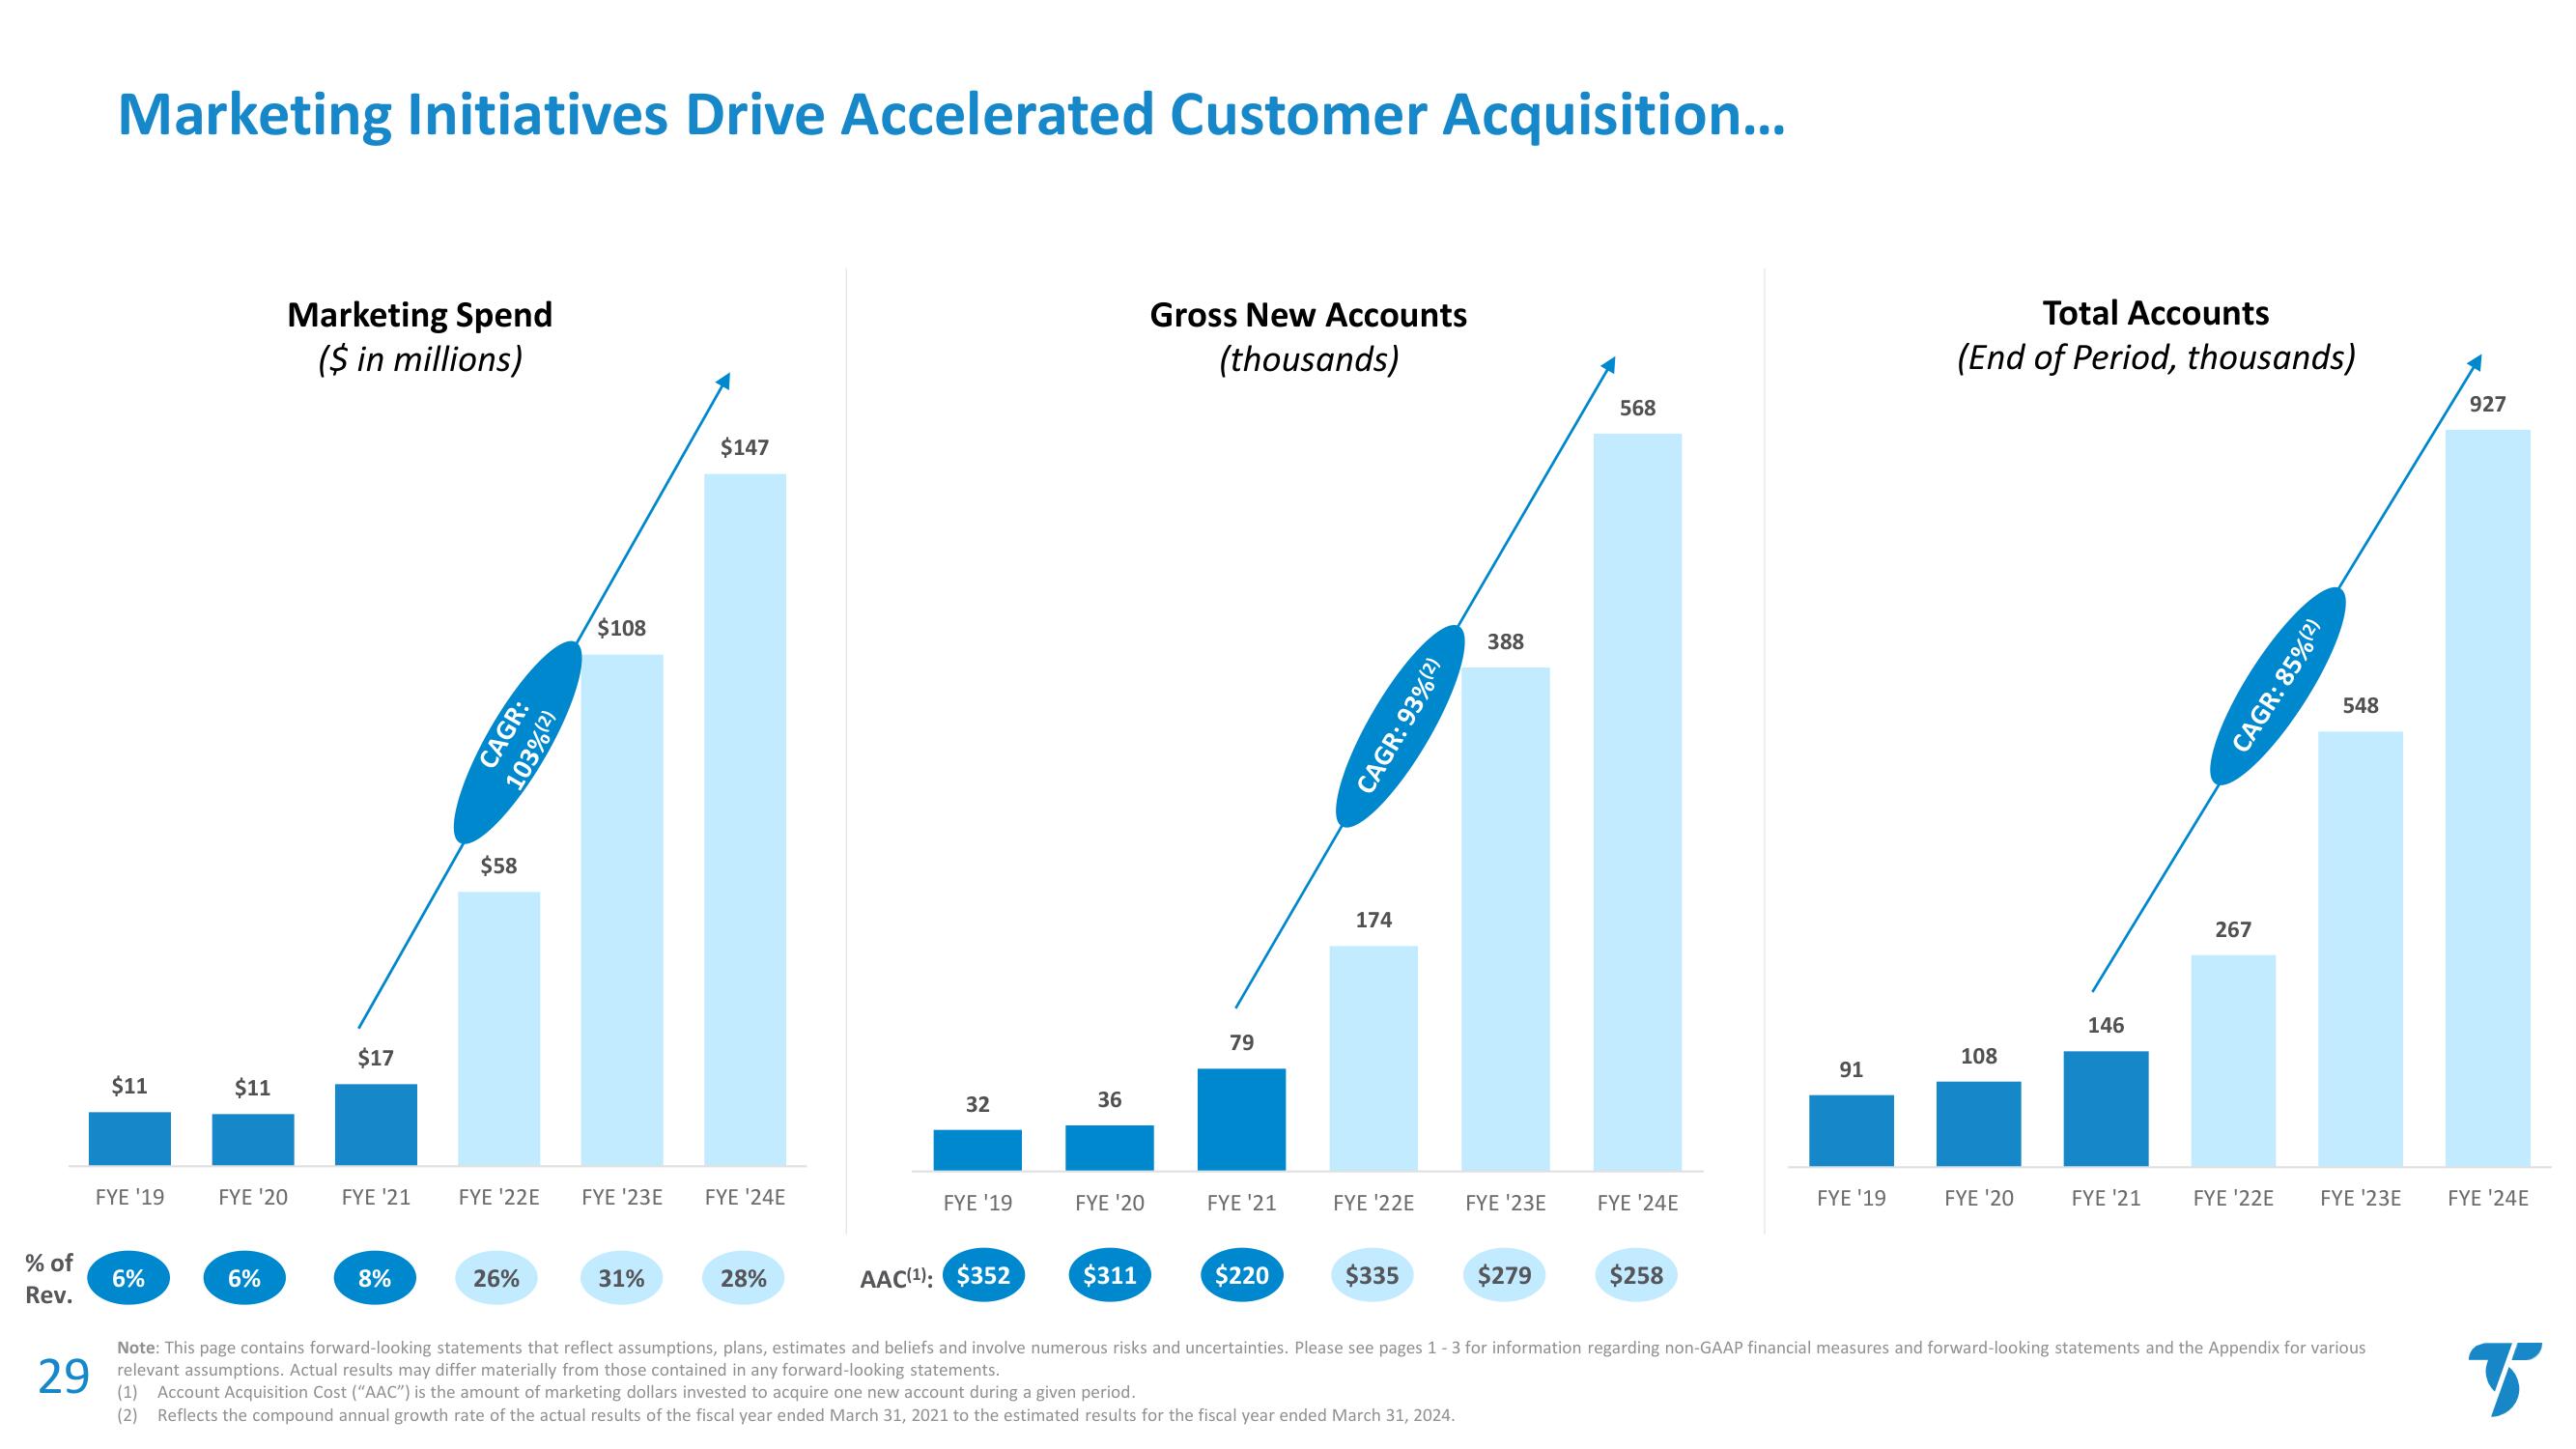
Marketing Initiatives Drive Accelerated Customer Acquisition...
$11
FYE '19
6%
$11
Marketing Spend
($ in millions)
FYE '20
6%
$17
FYE 21
8%
CAGR:
103% (²)
$58
FYE '22E
26%
$108
FYE '23E
31%
$147
FYE '24E
28%
32
FYE '19
AAC(¹): $352
36
FYE '20
$311
Gross New Accounts
(thousands)
79
FYE '21
$220
174
FYE '22E
$335
CAGR: 93% (2
388
FYE '23E
$279
568
FYE '24E
$258
91
FYE '19
Total Accounts
(End of Period, thousands)
108
FYE '20
146
FYE '21
267
FYE '22E
CAGR: 85% (2)
548
FYE '23E
Note: This page contains forward-looking statements that reflect assumptions, plans, estimates and beliefs and involve numerous risks and uncertainties. Please see pages 1-3 for information regarding non-GAAP financial measures and forward-looking statements and the Appendix for various
relevant assumptions. Actual results may differ materially from those contained in any forward-looking statements.
(1) Account Acquisition Cost ("AAC") is the amount of marketing dollars invested to acquire one new account during a given period.
(2) Reflects the compound annual growth rate of the actual results of the fiscal year ended March 31, 2021 to the estimated results for the fiscal year ended March 31, 2024.
927
FYE '24E
BView entire presentation