WeWork Results Presentation Deck
Key performance indicators
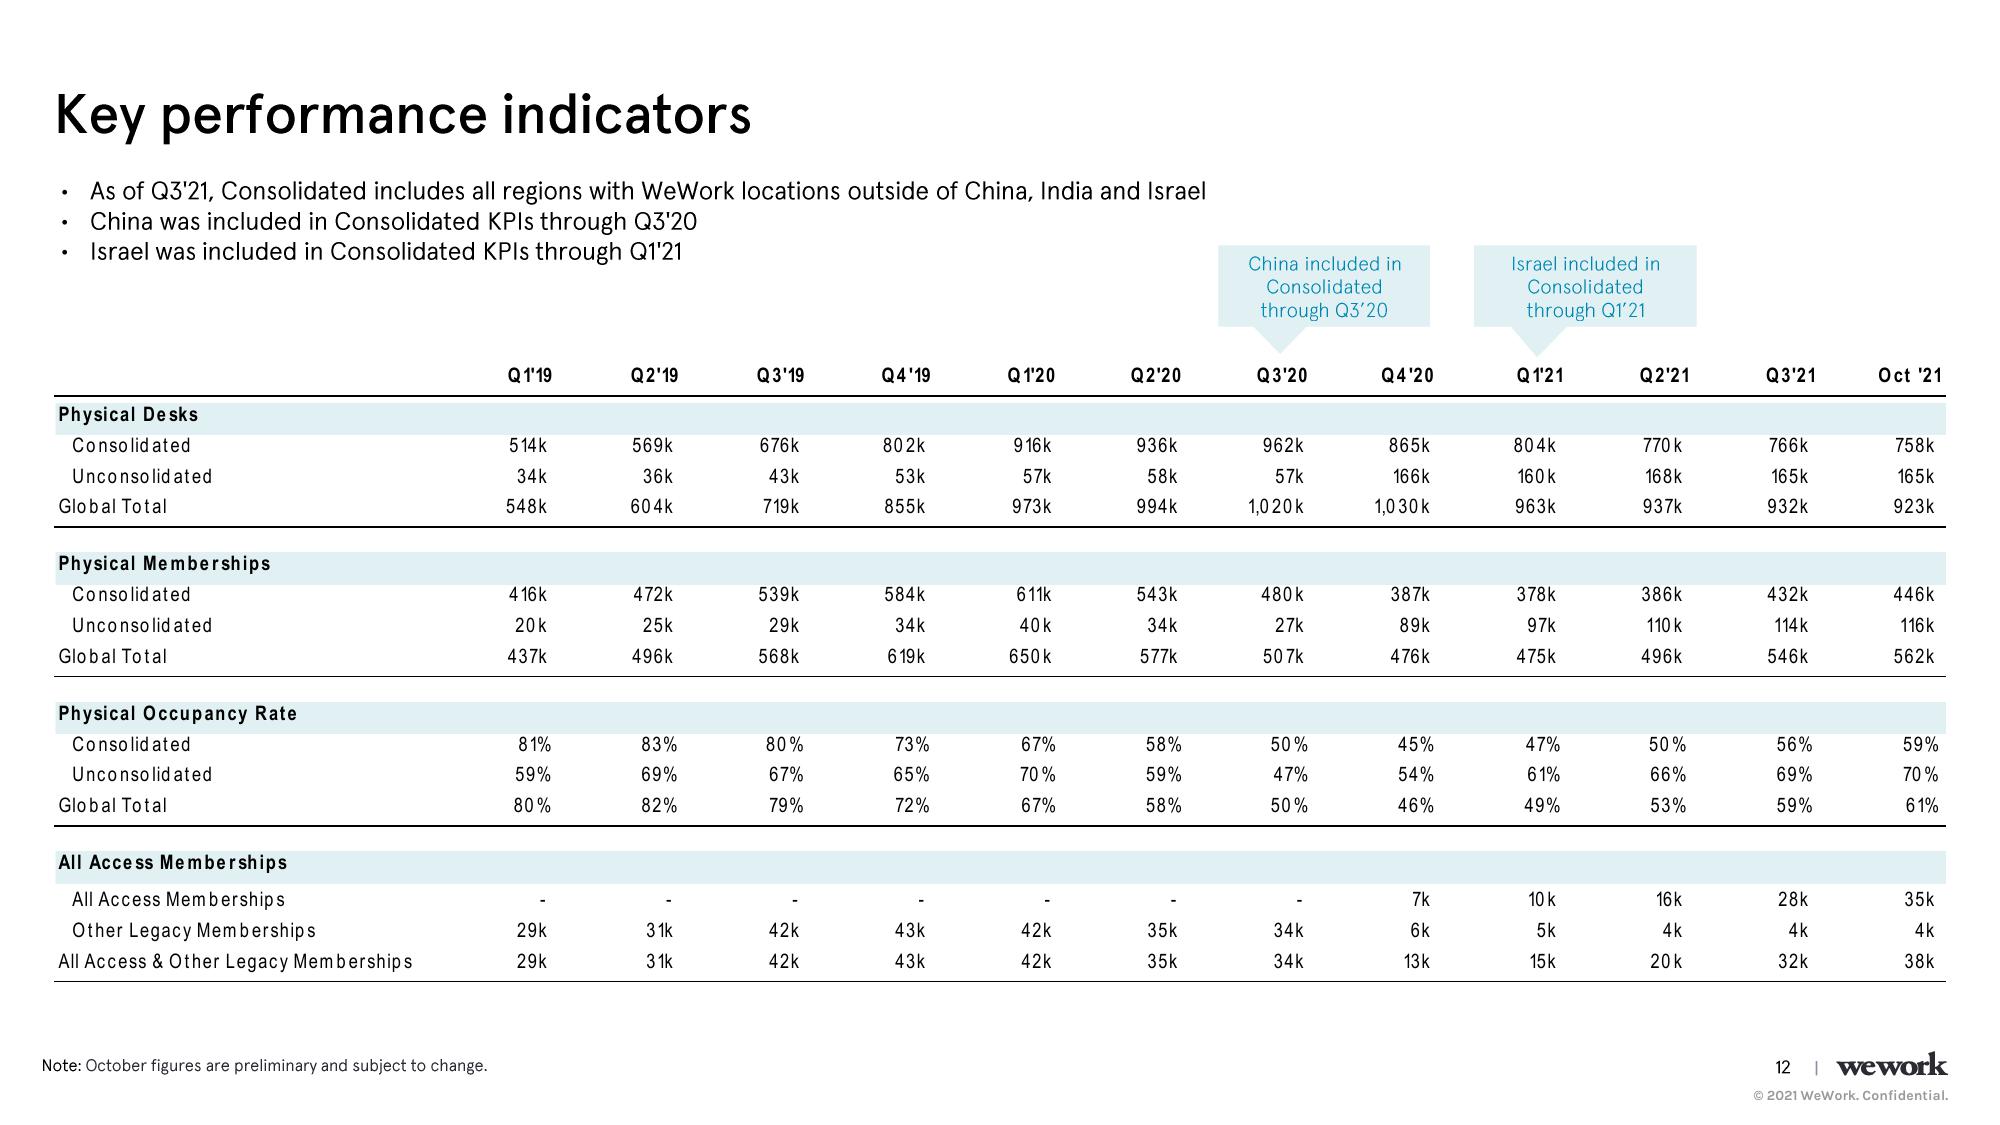
As of Q3'21, Consolidated includes all regions with WeWork locations outside of China, India and Israel
China was included in Consolidated KPIs through Q3'20
Israel was included in Consolidated KPIs through Q1'21
Physical Desks
Consolidated
Unconsolidated
Global Total
Physical Memberships
Consolidated
Unconsolidated
Global Total
Physical Occupancy Rate
Consolidated
Unconsolidated
Global Total
All Access Memberships
All Access Memberships
Other Legacy Memberships
All Access & Other Legacy Memberships
Note: October figures are preliminary and subject to change.
Q1'19
514k
34k
548k
416k
20k
437k
81%
59%
80%
29k
29k
Q2'19
569k
36k
604k
472k
25k
496k
83%
69%
82%
31k
w w
31k
Q3'19
676k
43k
719k
539k
29k
568k
80%
67%
79%
42k
42k
Q4'19
802k
53k
855k
584k
34k
619k
73%
65%
72%
43k
43k
Q1'20
916k
57k
973k
611k
40k
650 k
67%
70%
67%
42k
42k
Q2'20
936k
58k
994k
543k
34k
577k
58%
59%
58%
35k
35k
China included in
Consolidated
through Q3'20
Q3'20
962k
57k
1,020 k
480k
27k
50 7k
50%
47%
50%
34k
34k
Q4'20
865k
166k
1,030 k
387k
89k
476k
45%
54%
46%
7k
6k
13k
Israel included in
Consolidated
through Q1'21
Q1'21
804k
160 k
963k
378k
97k
475k
47%
61%
49%
10 k
5k
15k
Q2'21
770 k
168k
937k
386k
110 k
496k
50%
66%
53%
16k
4k
20k
Q3'21
766k
165k
932k
432k
114k
546k
56%
69%
59%
28k
4k
32k
Oct ¹21
758k
165k
923k
446K
116k
562k
59%
70%
61%
35k
4k
38k
12 | wework
Ⓒ2021 WeWork. Confidential.View entire presentation