CL King Best Ideas Conference
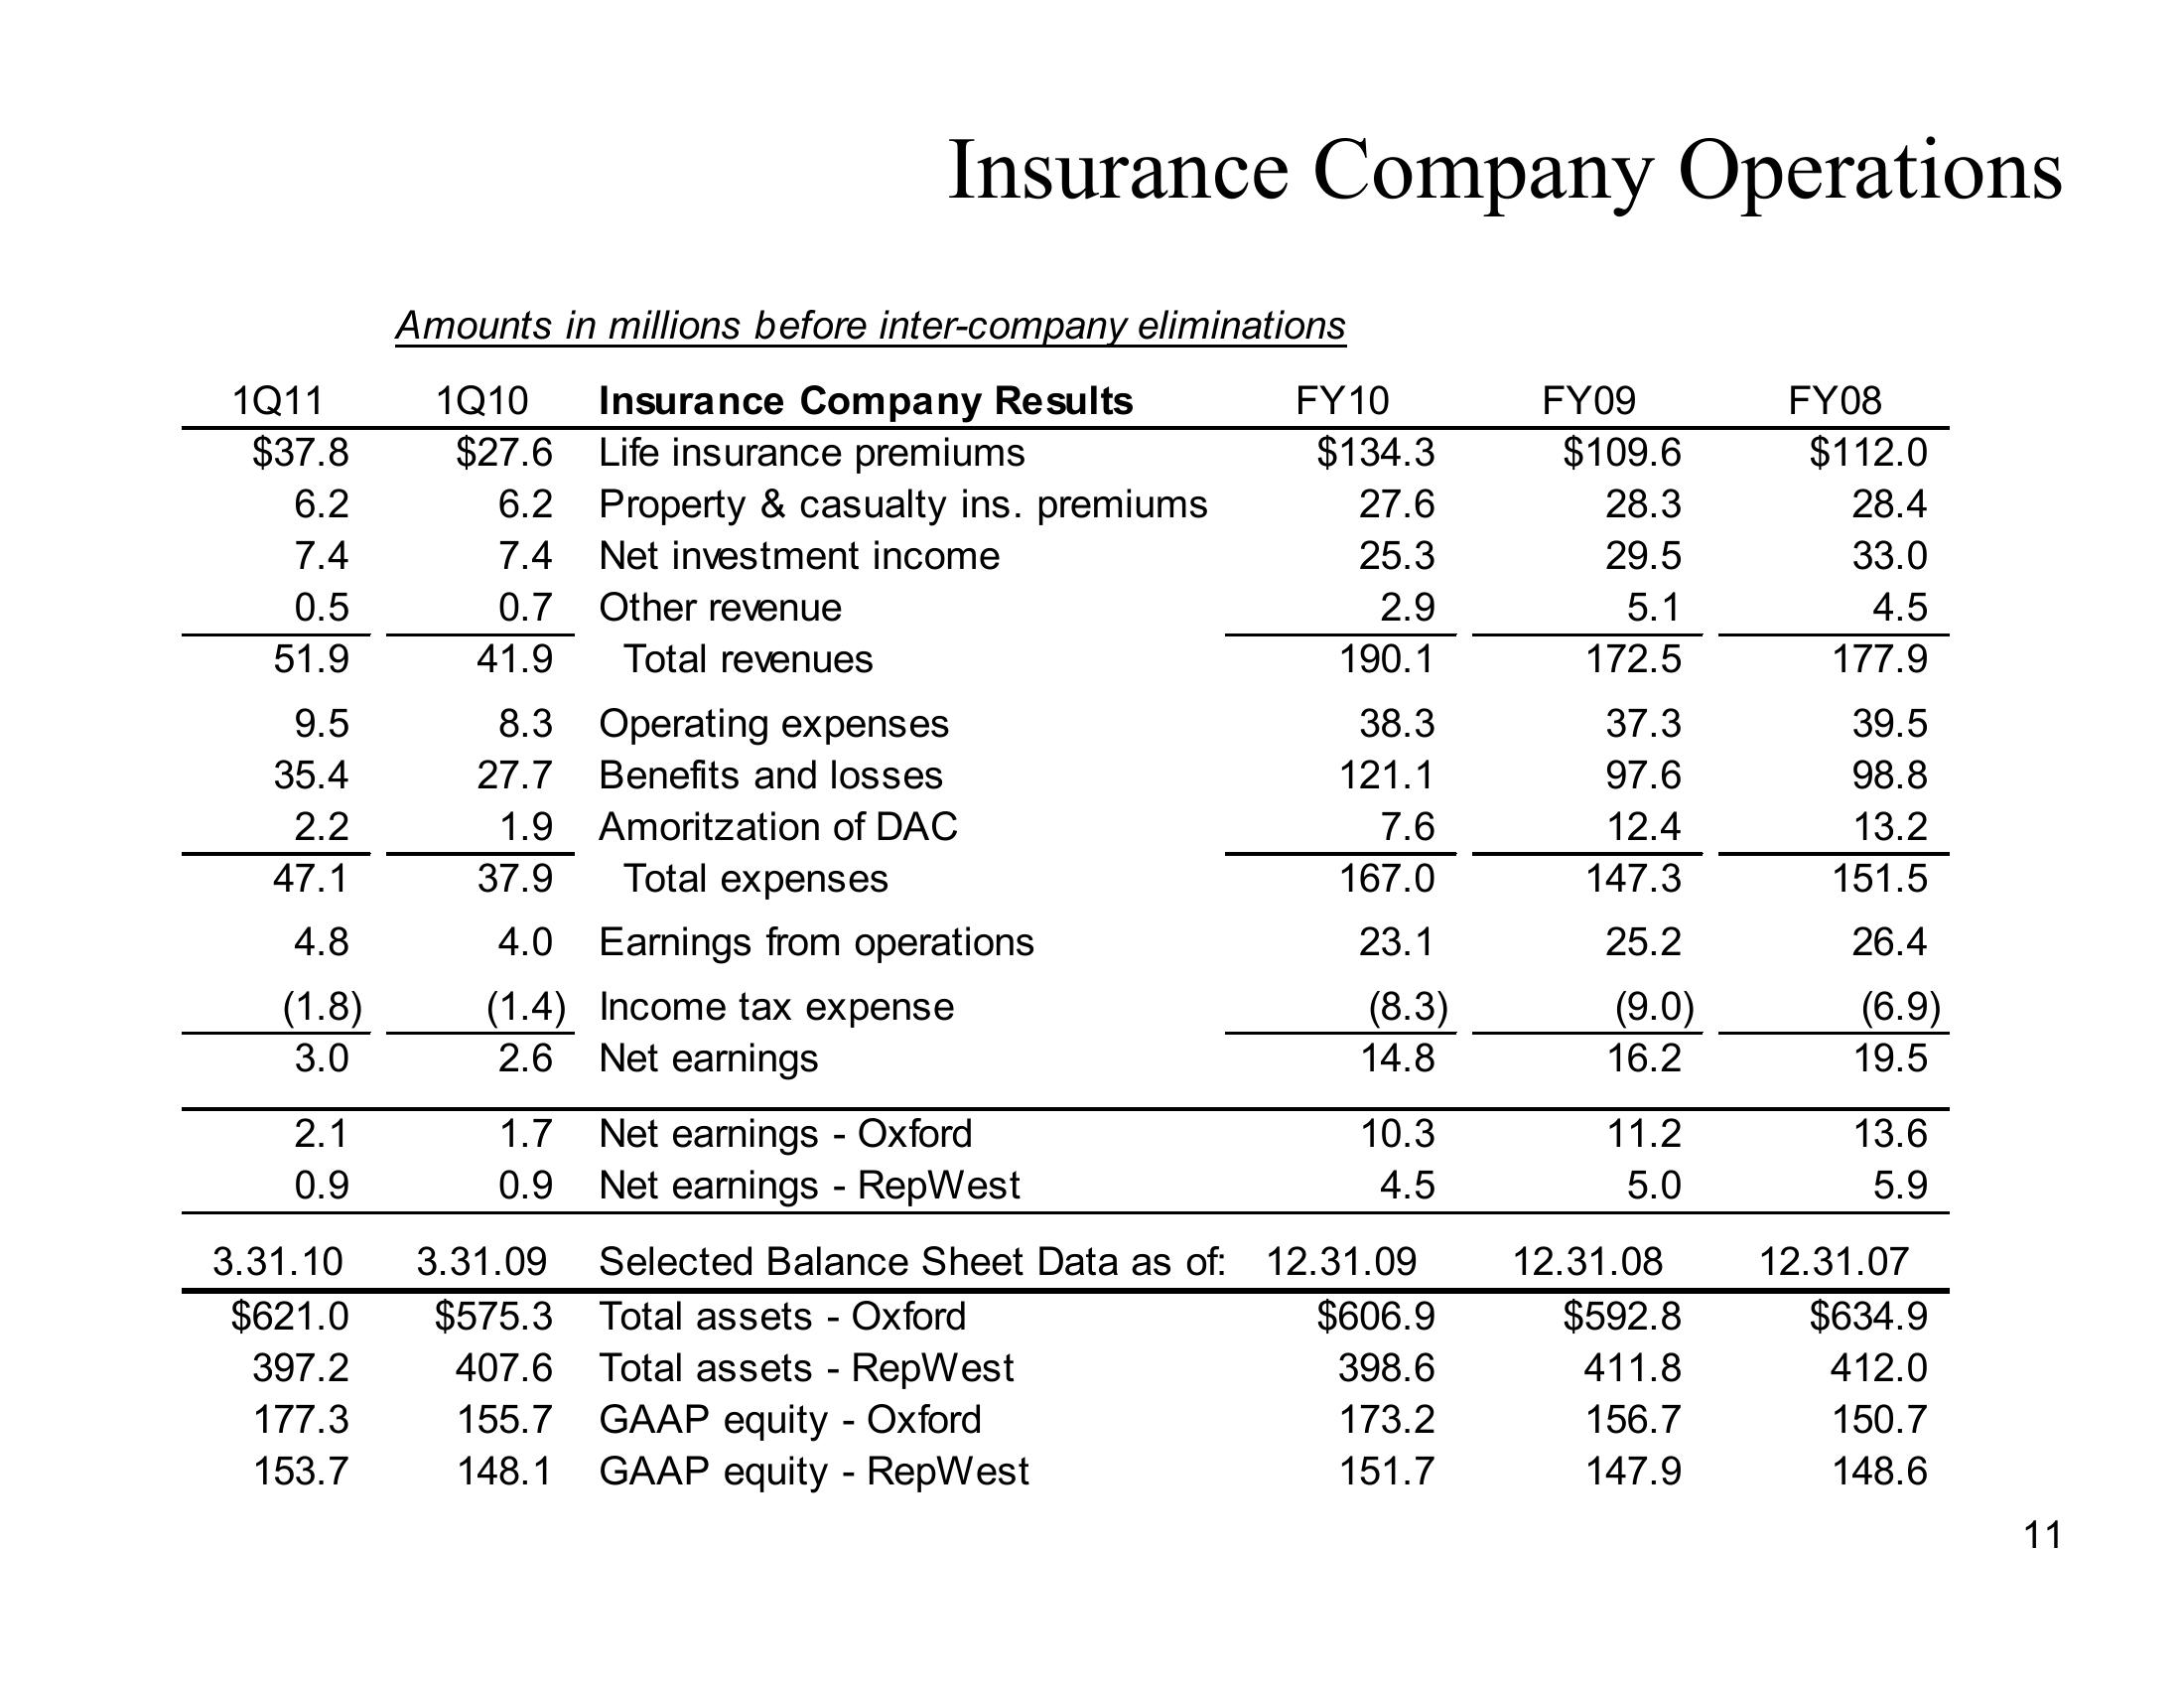
Insurance Company Operations
Amounts in millions before inter-company eliminations
1Q11
1Q10
Insurance Company Results
FY10
FY09
FY08
$37.8
$27.6
Life insurance premiums
$134.3
$109.6
$112.0
6.2
6.2
Property & casualty ins. premiums
27.6
28.3
28.4
7.4
7.4
Net investment income
25.3
29.5
33.0
0.5
0.7
Other revenue
2.9
5.1
4.5
51.9
41.9
Total revenues
190.1
172.5
177.9
9.5
8.3
Operating expenses
38.3
37.3
39.5
35.4
27.7
Benefits and losses
121.1
97.6
98.8
2.2
1.9
Amoritzation of DAC
7.6
12.4
13.2
47.1
37.9
Total expenses
167.0
147.3
151.5
4.8
4.0
Earnings from operations
23.1
25.2
26.4
(1.8)
(1.4)
Income tax expense
(8.3)
(9.0)
(6.9)
3.0
2.6
Net earnings
14.8
16.2
19.5
2.1
1.7
Net earnings Oxford
10.3
11.2
13.6
0.9
0.9
Net earnings - RepWest
4.5
5.0
5.9
3.31.10
3.31.09
Selected Balance Sheet Data as of: 12.31.09
12.31.08
12.31.07
$621.0
$575.3
Total assets - Oxford
$606.9
$592.8
$634.9
397.2
407.6
Total assets - RepWest
398.6
411.8
412.0
177.3
155.7
153.7
148.1
GAAP equity - Oxford
GAAP equity - RepWest
173.2
156.7
150.7
151.7
147.9
148.6
11View entire presentation