Uber Results Presentation Deck
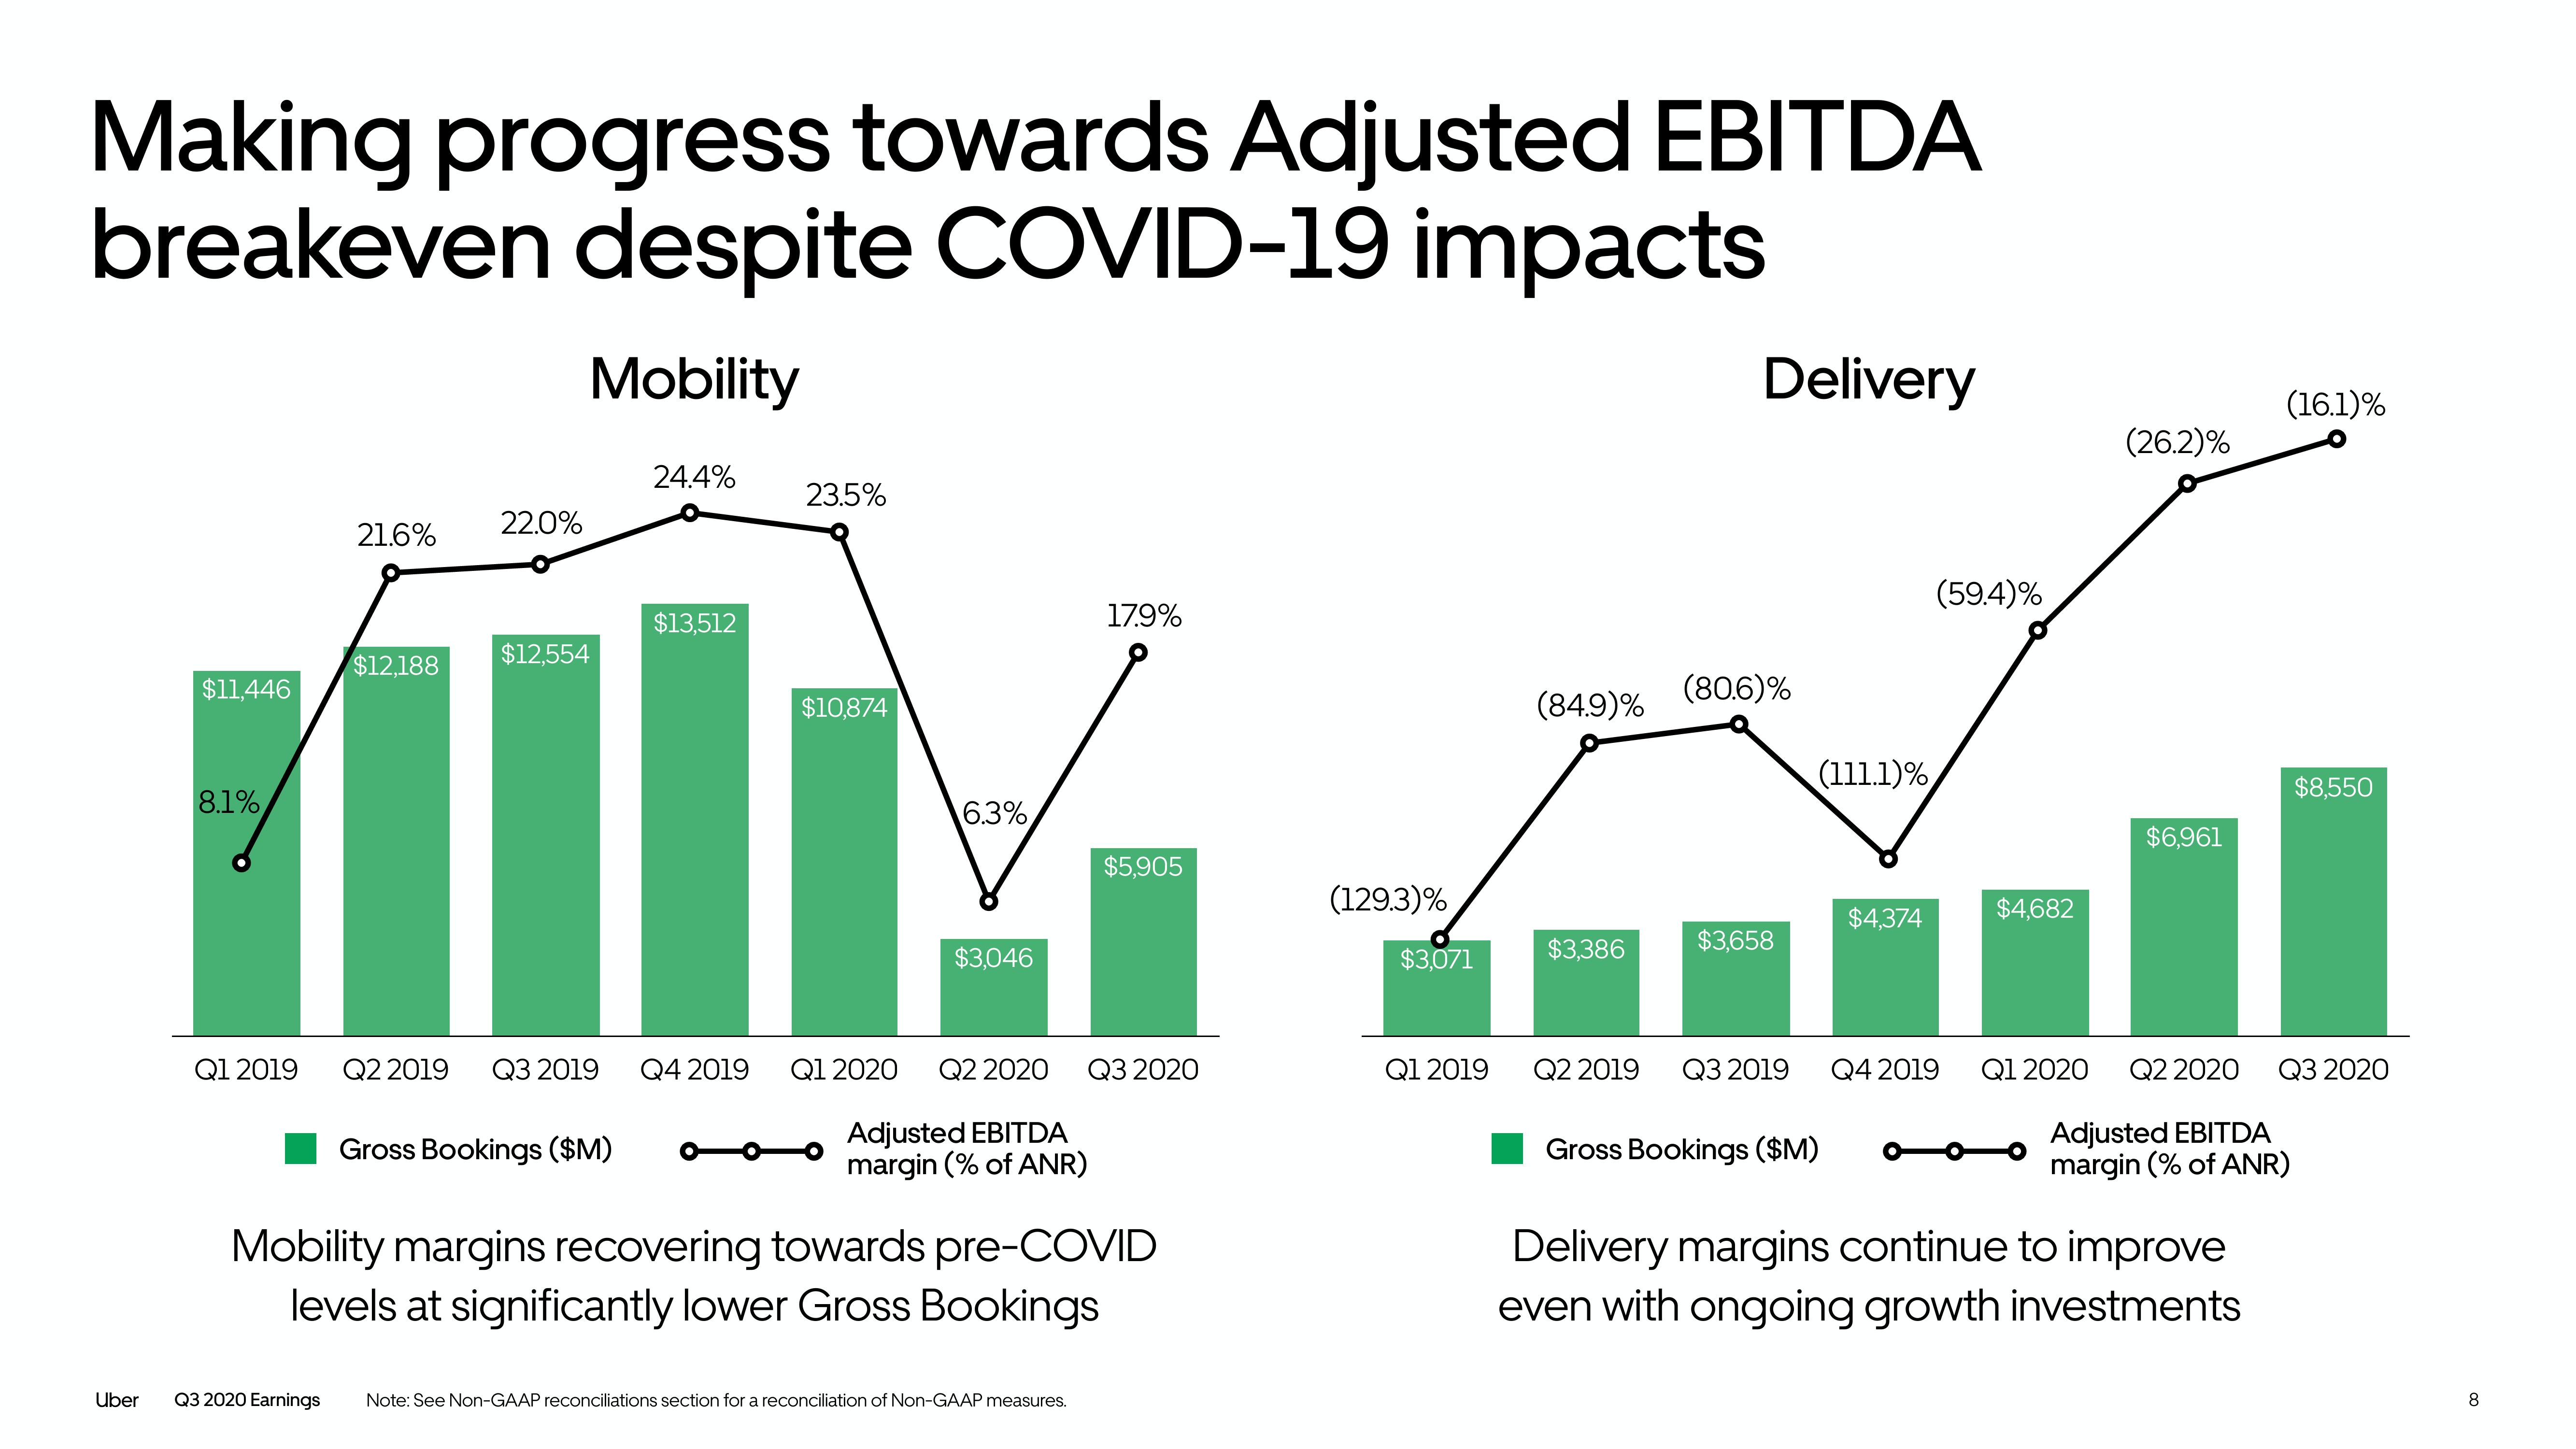
Making progress towards Adjusted EBITDA
breakeven despite COVID-19 impacts
Uber
$11,446
8.1%
21.6%
22.0%
Q3 2020 Earnings
$12,188 $12,554
Mobility
24.4%
Q1 2019 Q2 2019 Q3 2019 Q4 2019
Gross Bookings ($M)
$13,512
23.5%
$10,874
Q1 2020
6.3%
$3,046
Q2 2020
Adjusted EBITDA
margin (% of ANR)
17.9%
Note: See Non-GAAP reconciliations section for a reconciliation of Non-GAAP measures.
$5,905
Mobility margins recovering towards pre-COVID
levels at significantly lower Gross Bookings
Q3 2020
(129.3)%
$3,071
Q1 2019
(84.9)%
$3,386
Q2 2019
Delivery
(80.6)%
$3,658
Q3 2019
(111.1)%
Gross Bookings ($M)
$4,374
(59.4)%
Q4 2019
$4,682
Q1 2020
(26.2)%
$6,961
(16.1)%
Q2 2020 Q3 2020
Adjusted EBITDA
margin (% of ANR)
Delivery margins continue to improve
even with ongoing growth investments
$8,550
8View entire presentation