Credit Suisse Investment Banking Pitch Book
CONFIDENTIAL
Assumptions
Tax Rate
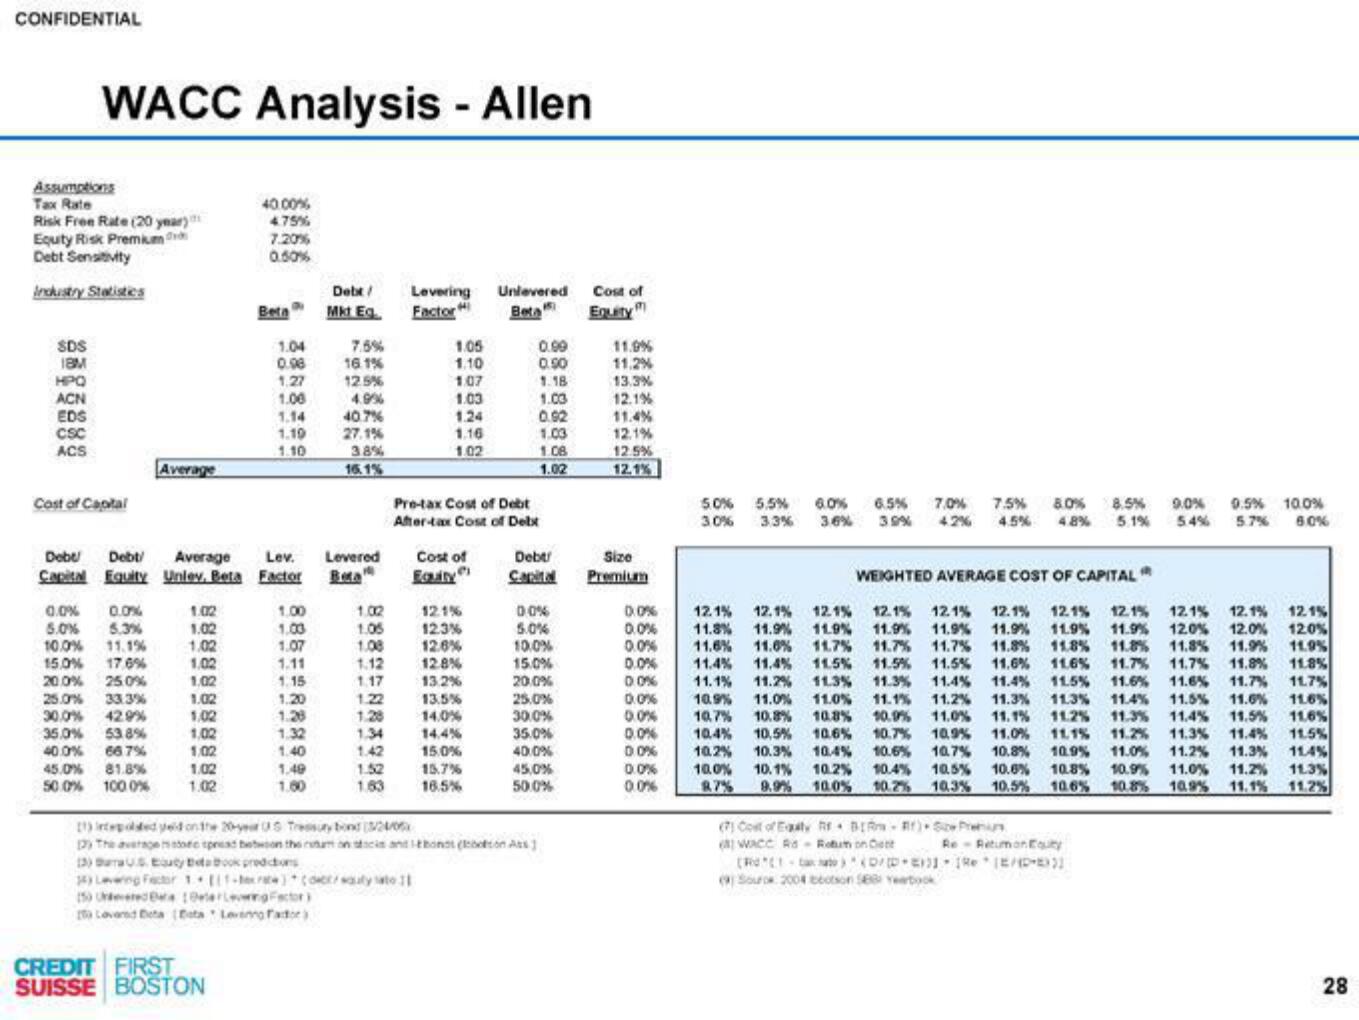
WACC Analysis - Allen
Risk Free Rate (20 year)
Equity Risk Premium
Debt Sensitivity
Industry Statistics
SDS
18M
HPQ
ACN
EDS
CSC
ACS
Cost of Capital
0.0% 0.0%
5.0% 5.3%
10.0% 11.1%
15.0% 17.6%
20.0%
25.0%
25.0% 33.3%
30.0% 42.9%
35.0% 53.8%
40.0%
66.7%
Average
45.0% 81.8%
50.0% 100.0%
1.02
1.02
1.02
1.02
1.02
1.02
1,02
1,02
1.02
1.02
1.02
40.00%
4.75%
7.20%
0.50%
Debu Debt/ Average Lev.
Capital Equity Unlev, Beta Factor
CREDIT FIRST
SUISSE BOSTON
Beta
a
1.04
0.98
1.27
1.00
1.14
1.19
1.10
1.00
1.00
1.07
1.11
1.15
1.20
1.28
1.32
1.40
1.49
1.00
Debt/
Mkt Eg
16.1%
12.5%
4.9%
40.7%
27.1%
3.8%
16.1%
Levered
Beta
1.02
1.05
1.08
1.12
1.17
1.22
Levering
Factor H
1.28
1.34
1.42
1.05
1.10
1.07
1.03
1.24
1.16
1.02
Cost of
Equity
Pre-tax Cost of Debt
After-tax Cost of Debt
12.1%
12.3%
12.6%
12.8%
13.2%
13.5%
14.0%
14.4%
15.0%
1.52 15.7%
1.63
16.5%
Unlevered Cost of
Beta
Equity
0.99
0.50
1.18
1.03
0.92
1.03
1.08
1.02
Debt!
Capital
0.0%
5.0%
10.0%
15.0%
20.0%
25.0%
30.0%
35.0%
40.0%
(1) intepolded yeld on the 20-year 05 Tressury bond (3/24/0
3) The averagere tprest bewoon the ruum on stocks and bonos (on Ass
13) Bara US Eutybetabook predictions
34) Levering Factor 1 (11-rate)(owcwaty at 11
(5) de 10elereng Factor)
Lovered Beta (Ests Levenno Fador)
45,0%
50.0%
11.9%
11.2%
13.3%
12.1%
11.4%
12.1%
12.5%
12.1%
Size
Premium
0.0%
0.0%
0.0%
0.0%
0.0%
0.0%
0.0%
0.0%
0.0%
0.0%
0.0%
5.0% 5,5 %
3.0% 3.3 %
6.0%
3.6 %
6.5% 7.0%
39% 4.2 %
7.5 %
4.5 %
80%
4.8 %
WEIGHTED AVERAGE COST OF CAPITAL
(7) Cost of Eaty RE BIR-R)
(8) WACCRS- Rotunon Cent
8.5% 9.0% 0.5% 100%
5.1% 54% 5.7% 6.0%
12.1% 12.1% 12.1% 12.1% 12.1% 12.1% 12.1% 12.1% 12.1% 12.1% 12.1%
11.8% 11.9% 11.9% 11.9% 11.9% 11.9% 11.9% 11.9% 12.0% 12.0% 12.0%
11.6% 11.0% 11.7% 11.7% 11.7% 11.8% 11.8% 11.8% 11.8%
11.8% 11.9% 11.9%
11.4% 11.4% 11.5% 11.5% 11.5% 11.6% 11.6% 11.7% 11.7% 11.8% 11.8%
11.1% 11.2% 11.3%
11.3% 11.3%
11.3% 11.4% 11.4% 11.5% 11.6% 11.6% 11.7% 11.7%
10.9% 11.0% 11.0% 11.1% 11.2% 11.3% 11.3% 11.4% 11.5% 11.6% 11.6%
10.7% 10.8% 10.8% 10.9% 11.0% 11.1% 11.2% 11.3% 11.4% 11.5% 11.6%
10.4% 10,5% 10.6% 10.7% 10.9% 11.0% 11.1% 11.2% 11.3% 11.4% 11.5%
10,2% 10.3% 10.4% 10.6% 10.7% 10.8% 10.9% 11.0% 11.2% 11.3% 11.4%
10.0% 10.1% 10.2% 10.4% 10.5% 10.6 % 10.8% 10.9% 11.0% 11.2% 11.3%
87% 9.9% 10.0% 10.2% 10.3% 10.5% 10.6 % 10.8% 10.9% 11.1% 11.2%
Sow Premiums
Re-Retumonauty
[Rd1) (D/D] [Re [E/DE) }]
(9) Sour 2004 bbotson SEB Yearbook
28View entire presentation