Zegna SPAC Presentation Deck
4. Key financials overview
ZEGNA GROUP
CORE ADJ. EBIT EVOLUTION
Dec-YE
Starting Core Adj. EBIT
A revenues
A gross margin¹ %
A opex²
Ending Core Adj. EBIT
20XX Reference year
Ermenegildo Zegna Group
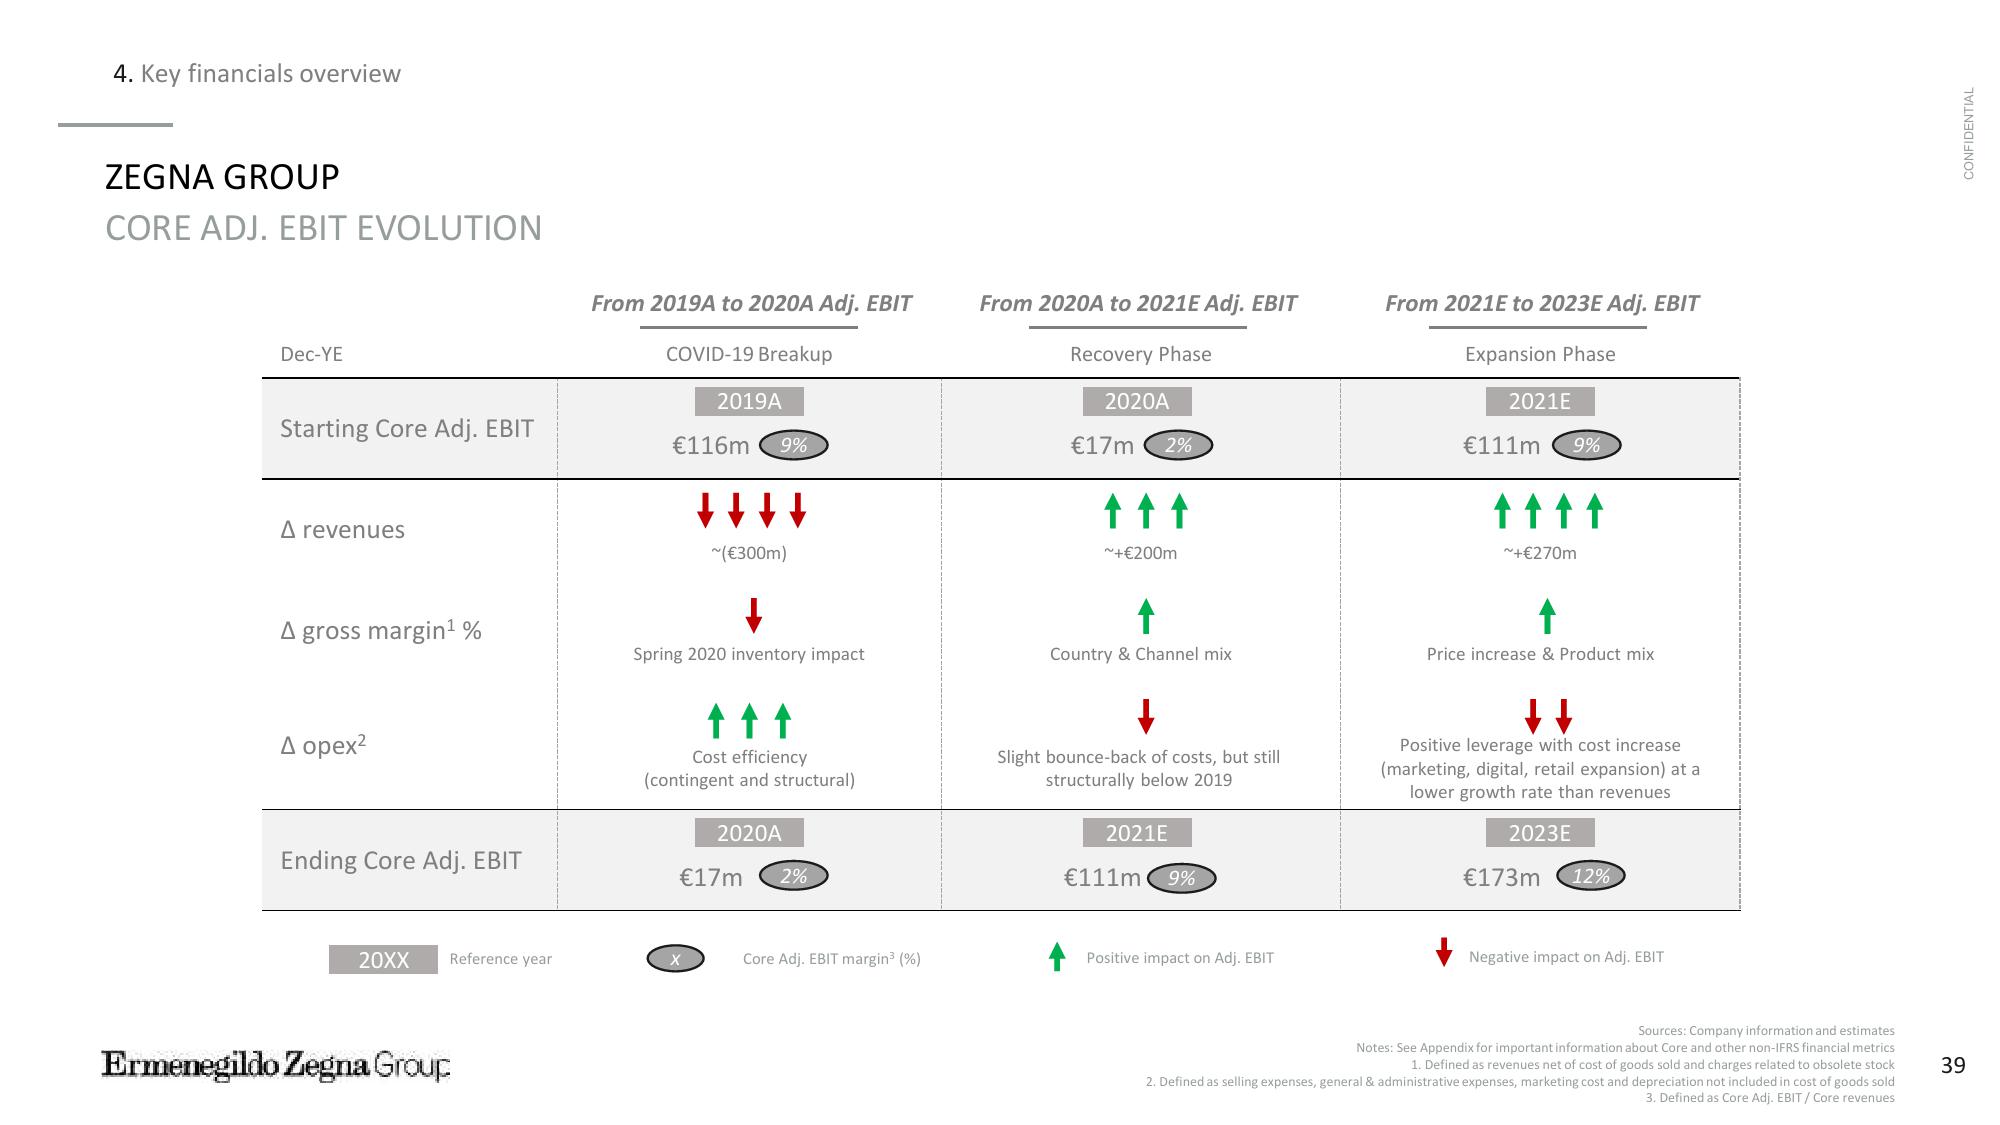
From 2019A to 2020A Adj. EBIT
COVID-19 Breakup
2019A
€116m
9%
↓↓↓↓
~(€300m)
Spring 2020 inventory impact
↑↑↑
Cost efficiency
(contingent and structural)
2020A
€17m 2%
Core Adj. EBIT margin³ (%)
From 2020A to 2021E Adj. EBIT
Recovery Phase
2020A
€17m
2%
↑↑↑
~+€200m
↑
Country & Channel mix
Slight bounce-back of costs, but still
structurally below 2019
2021E
€111m 9%
Positive impact on Adj. EBIT
From 2021E to 2023E Adj. EBIT
Expansion Phase
2021E
€111m
9%
↑↑↑↑
~+€270m
Price increase & Product mix
↓↓↓
Positive leverage with cost increase
(marketing, digital, retail expansion) at a
lower growth rate than revenues
2023E
€173m
12%
Negative impact on Adj. EBIT
Sources: Company information and estimates
Notes: See Appendix for important information about Core and other non-IFRS financial metrics
1. Defined as revenues net of cost of goods sold and charges related to obsolete stock
2. Defined as selling expenses, general & administrative expenses, marketing cost and depreciation not included in cost of goods sold
3. Defined as Core Adj. EBIT/ Core revenues
CONFIDENTIAL
39View entire presentation