Blackwells Capital Activist Presentation Deck
ILLUSTRATIVE RETURNS ANALYSIS
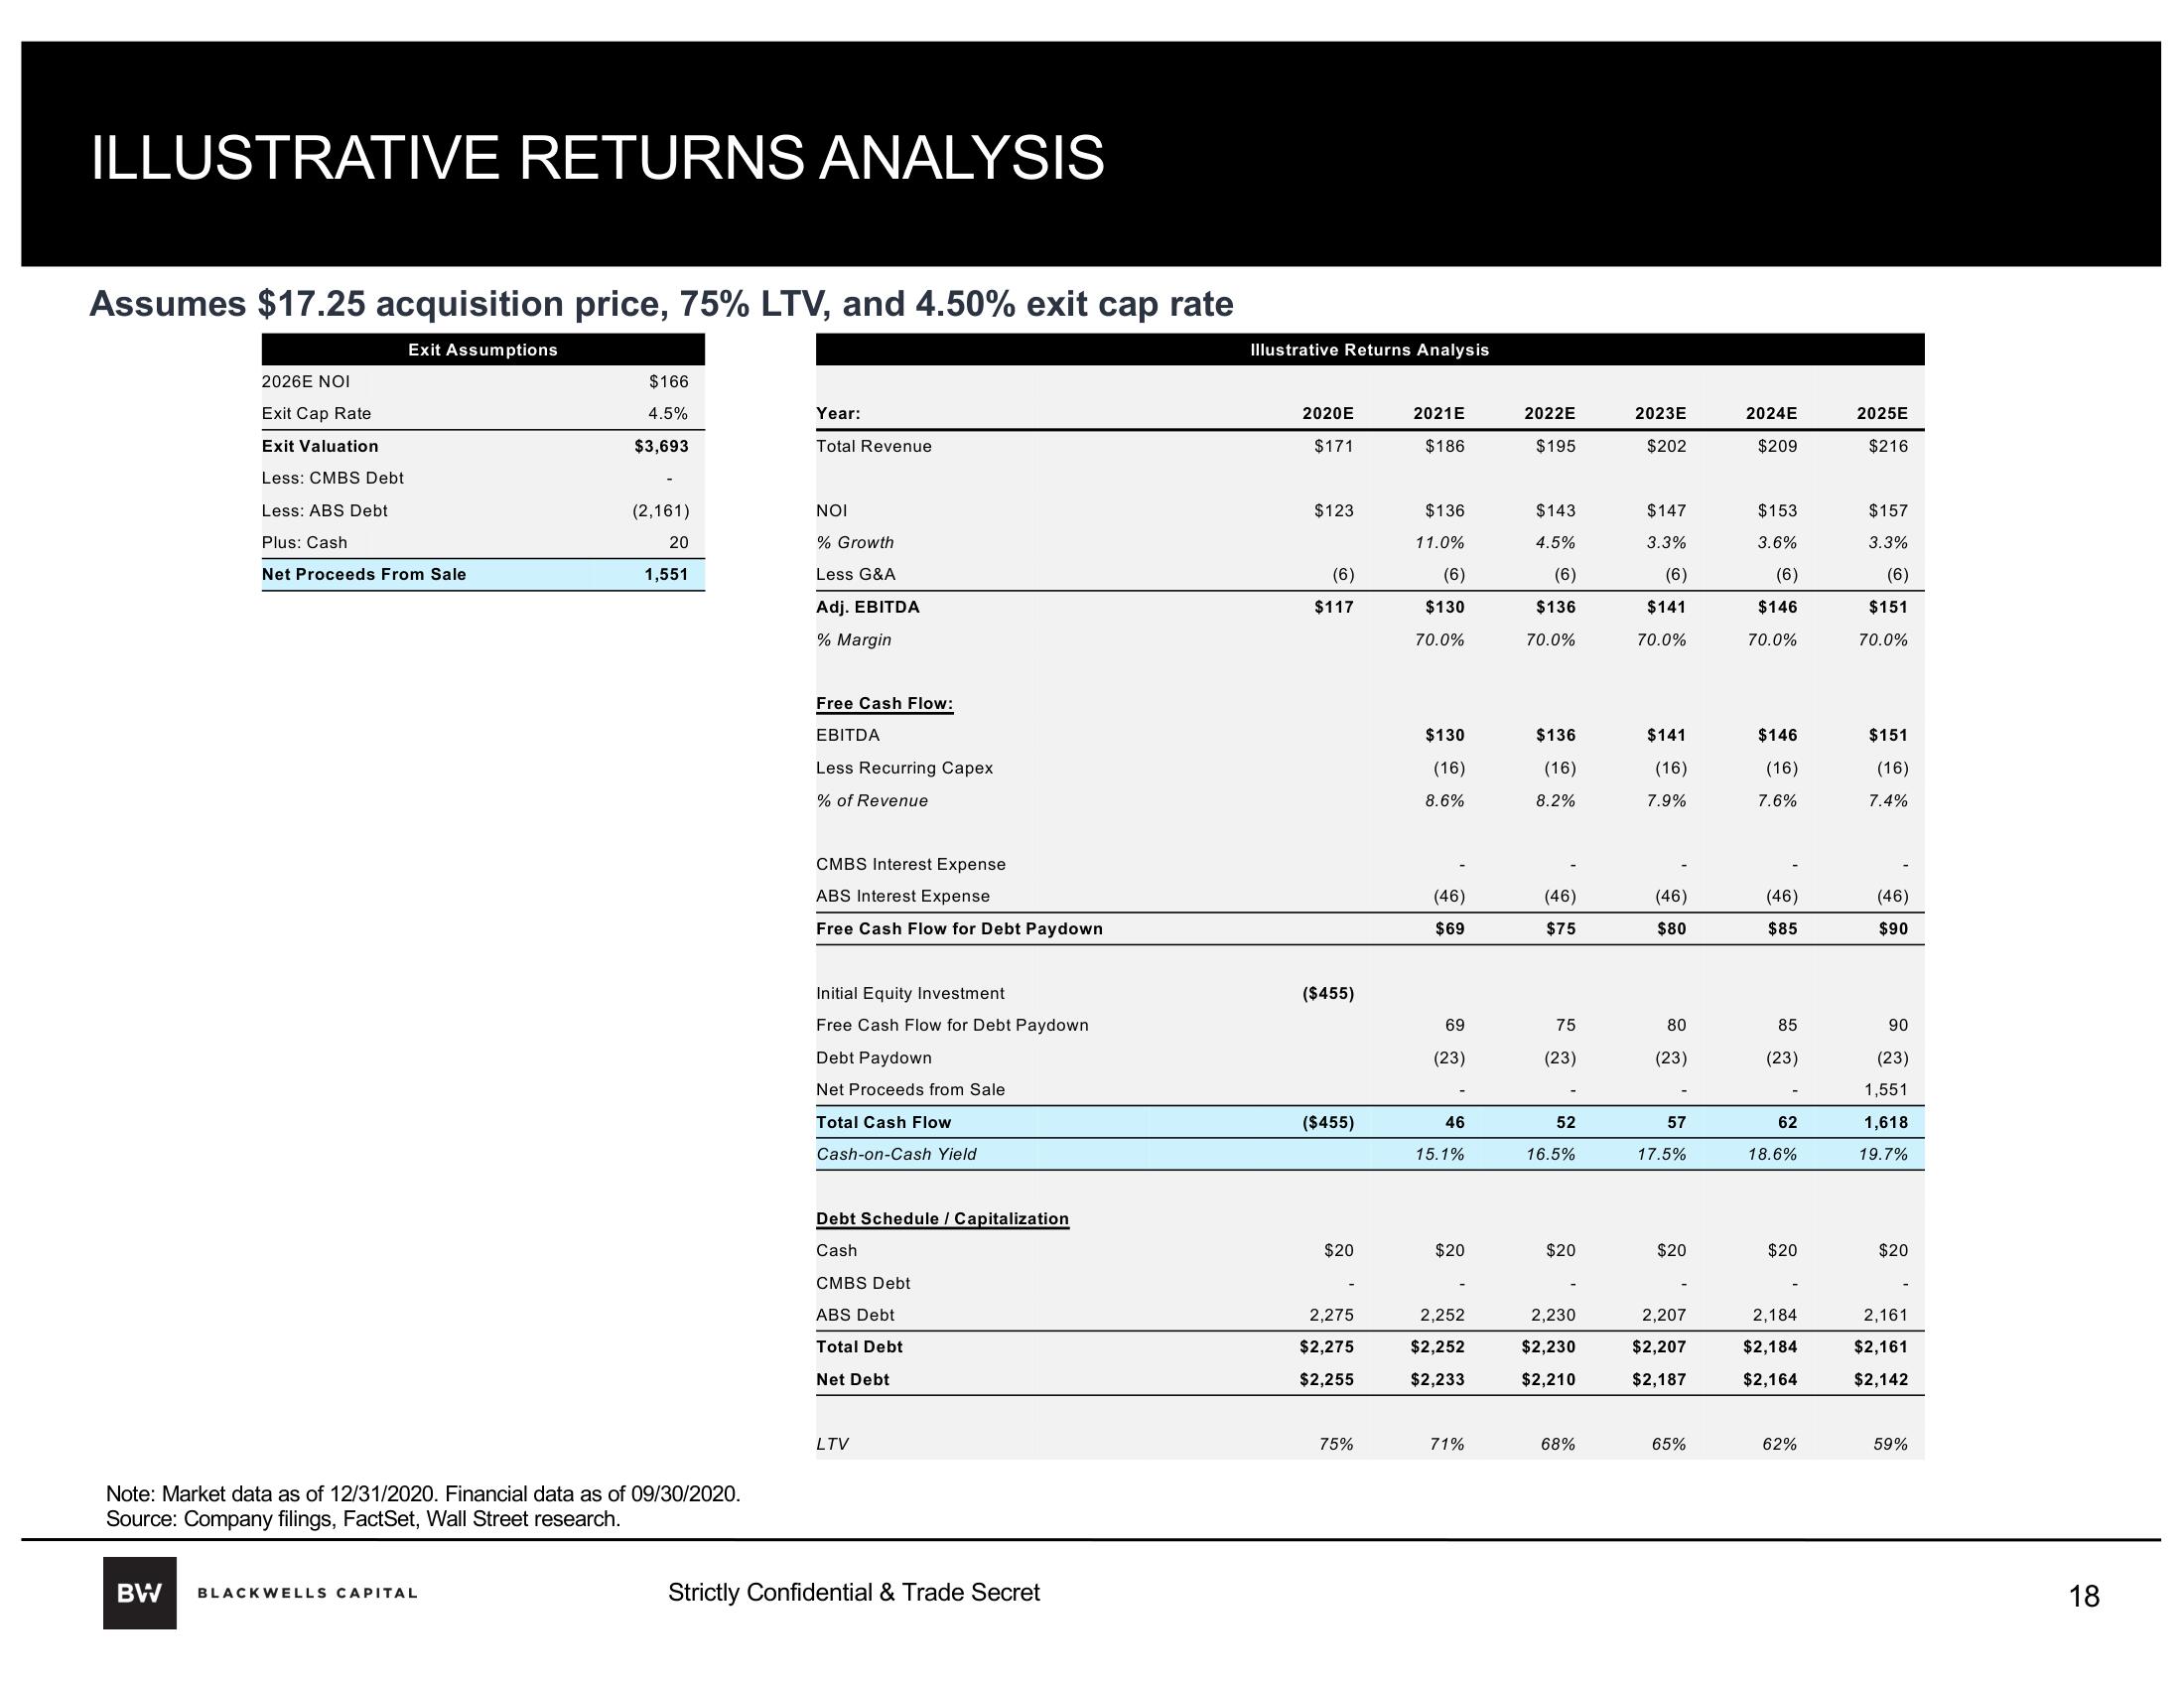
Assumes $17.25 acquisition price, 75% LTV, and 4.50% exit cap rate
Exit Assumptions
2026E NOI
Exit Cap Rate
Exit Valuation
Less: CMBS Debt
Less: ABS Debt
Plus: Cash
Net Proceeds From Sale
$166
4.5%
$3,693
BW BLACKWELLS CAPITAL
(2,161)
20
1,551
Note: Market data as of 12/31/2020. Financial data as of 09/30/2020.
Source: Company filings, FactSet, Wall Street research.
Year:
Total Revenue
NOI
% Growth
Less G&A
Adj. EBITDA
% Margin
Free Cash Flow:
EBITDA
Less Recurring Capex
% of Revenue
CMBS Interest Expense
ABS Interest Expense
Free Cash Flow for Debt Paydown
Initial Equity Investment
Free Cash Flow for Debt Paydown
Debt Paydown
Net Proceeds from Sale
Total Cash Flow
Cash-on-Cash Yield
Debt Schedule / Capitalization
Cash
CMBS Debt
ABS Debt
Total Debt
Net Debt
LTV
Strictly Confidential & Trade Secret
Illustrative Returns Analysis
2020E
$171
$123
(6)
$117
($455)
($455)
$20
2,275
$2,275
$2,255
75%
2021E
$186
$136
11.0%
(6)
$130
70.0%
$130
(16)
8.6%
(46)
$69
69
(23)
46
15.1%
$20
2,252
$2,252
$2,233
71%
2022E
$195
$143
4.5%
(6)
$136
70.0%
$136
(16)
8.2%
(46)
$75
75
(23)
52
16.5%
$20
2,230
$2,230
$2,210
68%
2023E
$202
$147
3.3%
(6)
$141
70.0%
$141
(16)
7.9%
(46)
$80
80
(23)
57
17.5%
$20
2,207
$2,207
$2,187
65%
2024E
$209
$153
3.6%
(6)
$146
70.0%
$146
(16)
7.6%
(46)
$85
85
(23)
62
18.6%
$20
2,184
$2,184
$2,164
62%
2025E
$216
$157
3.3%
(6)
$151
70.0%
$151
(16)
7.4%
(46)
$90
90
(23)
1,551
1,618
19.7%
$20
2,161
$2,161
$2,142
59%
18View entire presentation