Lazard Investor Presentation Deck slide image

Lazard Investor Presentation Deck

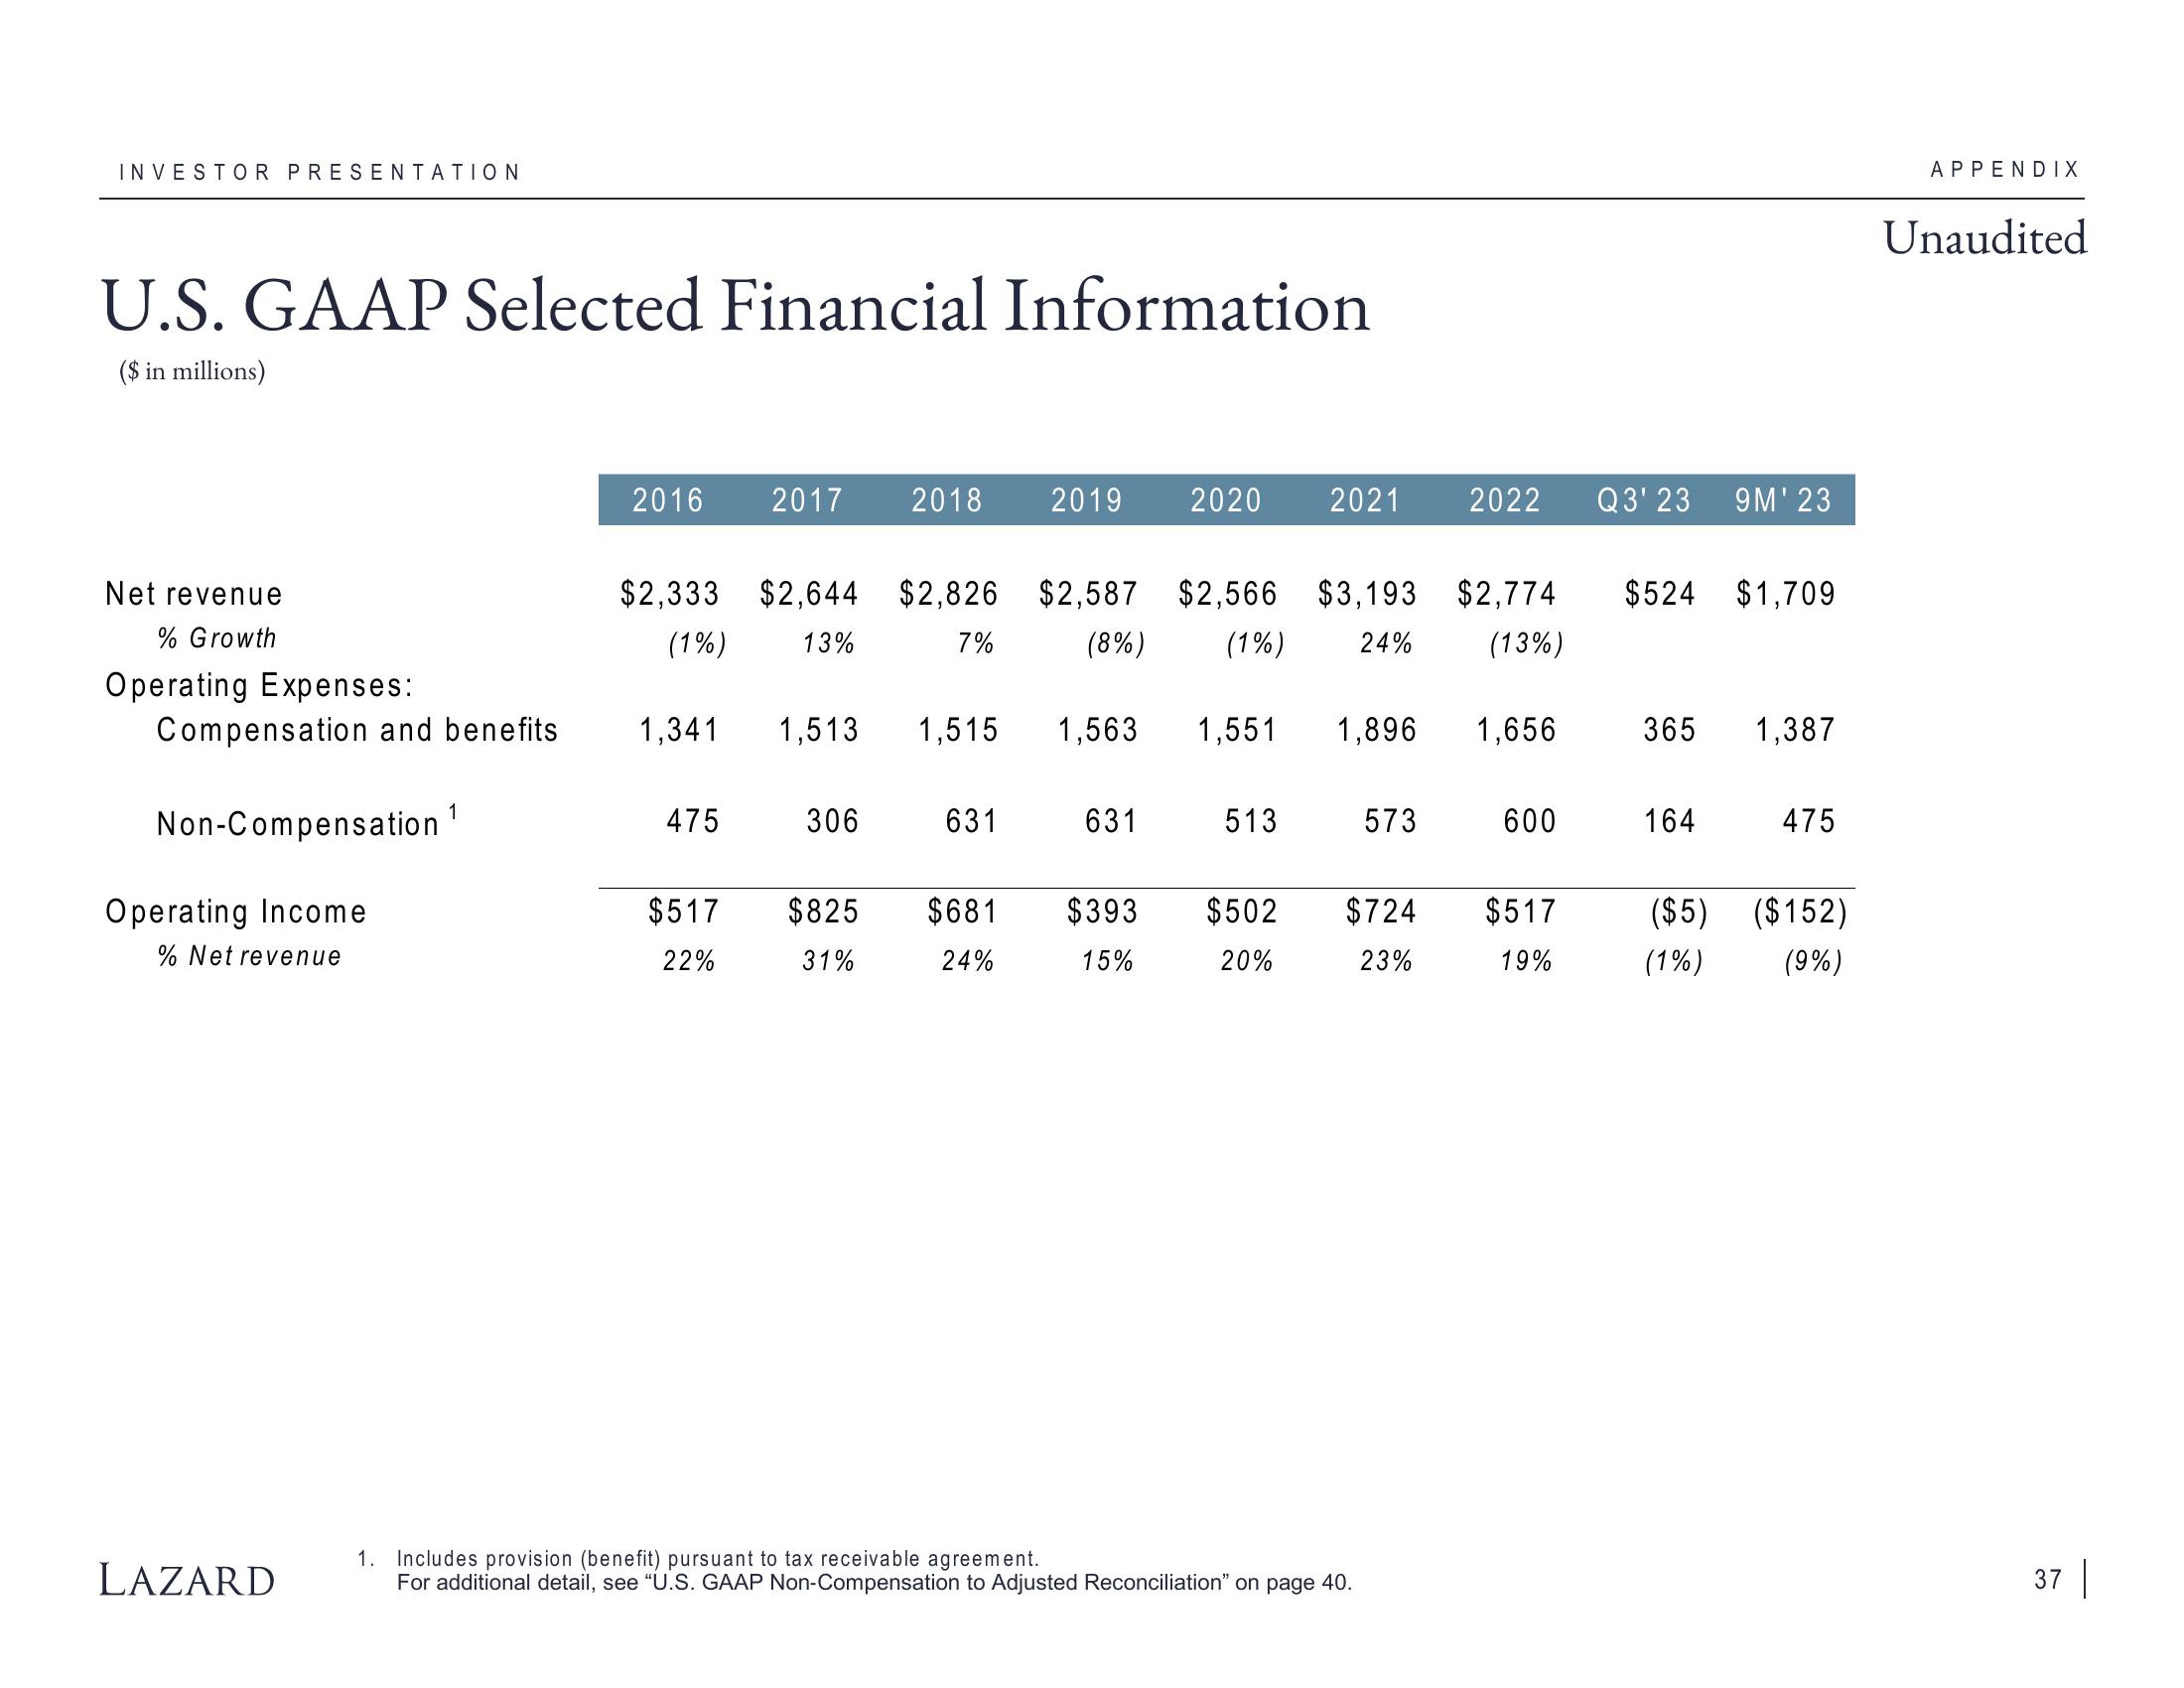
INVESTOR PRESENTATION U.S. GAAP Selected Financial Information ($ in millions) Net revenue % Growth Operating Expenses: Compensation and benefits Non-Compensation ¹ Operating Income % Net revenue LAZARD 2016 2017 2018 2019 $2,333 $2,644 $2,826 (1%) 13% 7% 1,341 475 $517 22% 1,513 1,515 306 631 $825 $681 31% 24% $2,587 $2,566 $3,193 (8%) (1%) 24% 2020 2021 631 $393 15% 1,563 1,551 1,896 1,656 513 $502 20% 2022 573 1. Includes provision (benefit) pursuant to tax receivable agreement. For additional detail, see "U.S. GAAP Non-Compensation to Adjusted Reconciliation" on page 40. $2,774 (13%) 600 $724 $517 23% 19% Q3' 23 9M' 23 $524 $1,709 365 164 1,387 475 ($5) ($152) (1%) (9%) APPENDIX Unaudited 37
View entire presentation