Bank of America Investment Banking Pitch Book
Illustrative Levered Returns Sensitivity
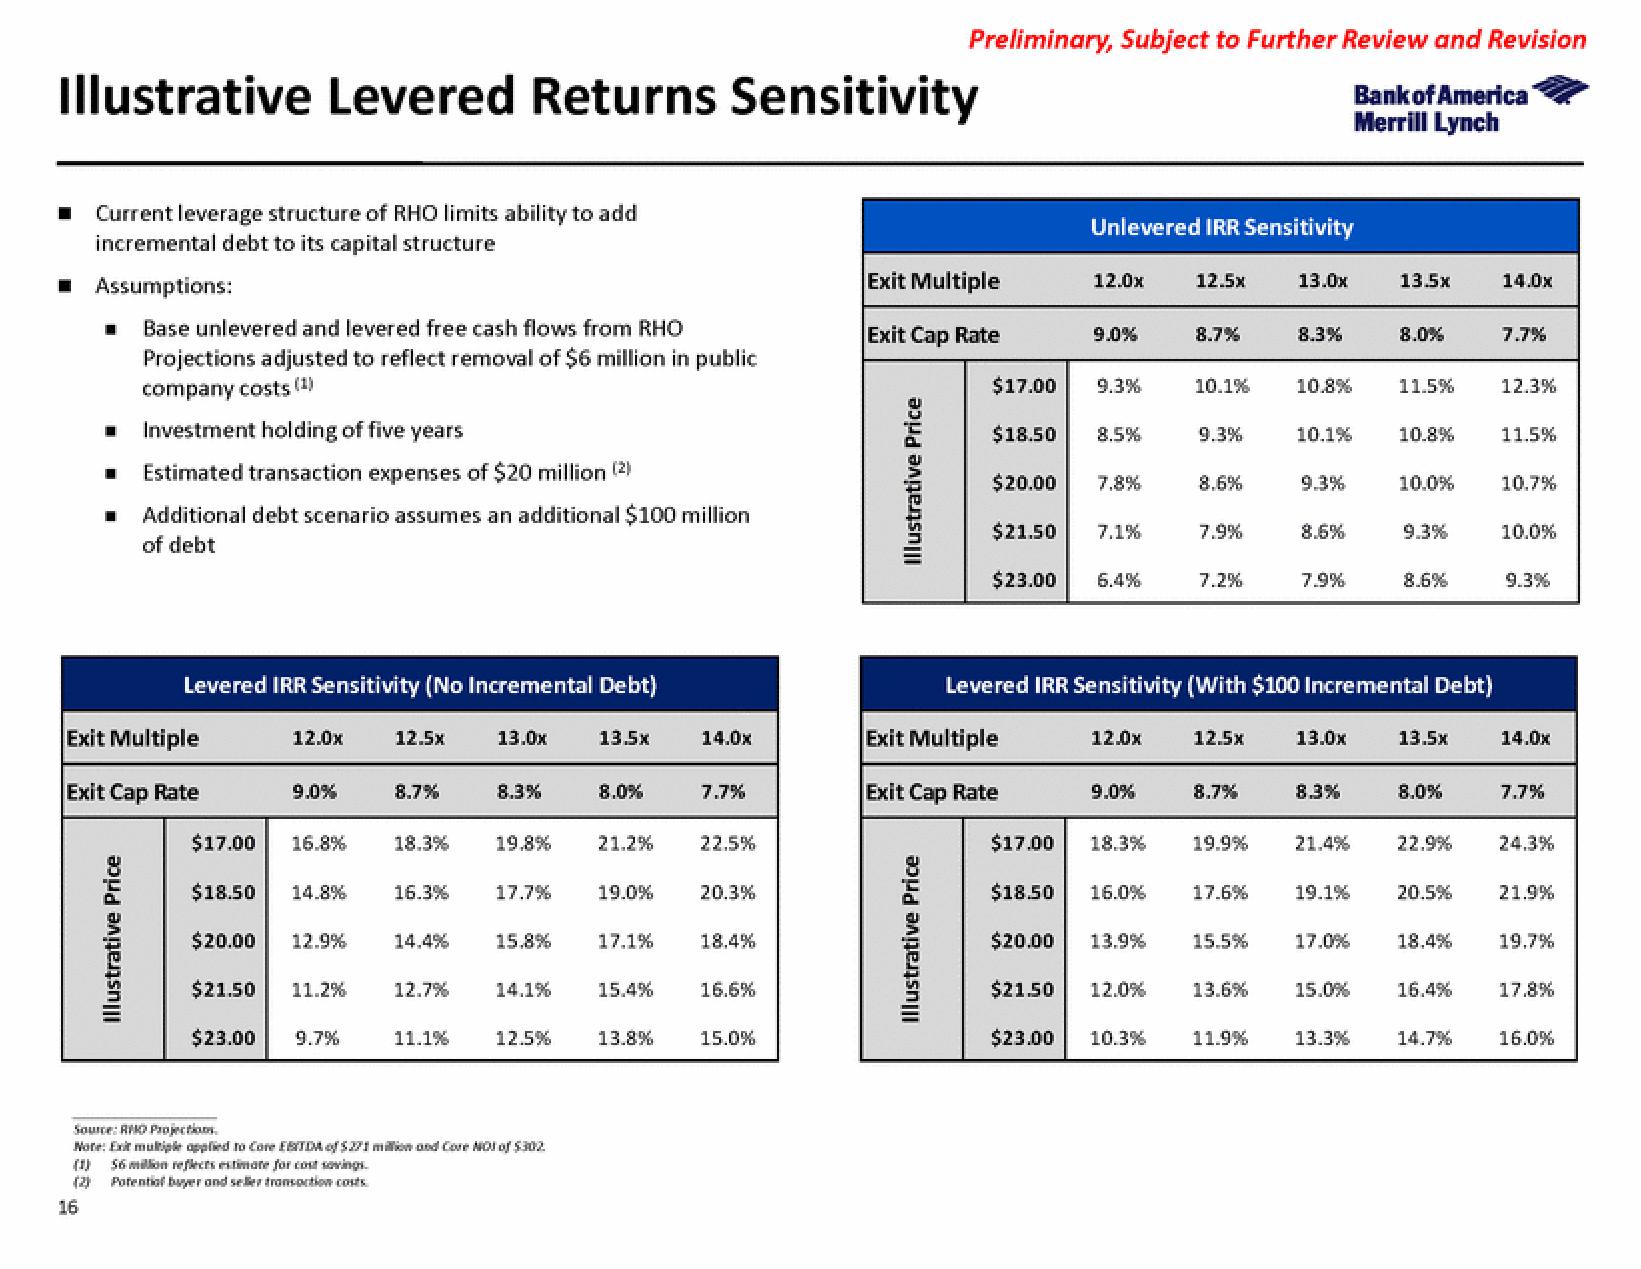
■ Current leverage structure of RHO limits ability to add
incremental debt to its capital structure
■ Assumptions:
■
(1)
(2)
■
16
Base unlevered and levered free cash flows from RHO
Projections adjusted to reflect removal of $6 million in public
company costs (1)
Investment holding of five years
Estimated transaction expenses of $20 million (2)
Exit Multiple
Exit Cap Rate
Illustrative Price
Additional debt scenario assumes an additional $100 million
of debt
Levered IRR Sensitivity (No Incremental Debt)
135
12.0x
9.0%
$17.00 16.8%
$18.50 14.8%
$20.00 12.9%
$21.50 11.2%
$23.00 9.7%
125x
8.7%
18.3%
16.3%
14.4%
12.7%
11.1%
13.0x
8.3%
19.8%
17.7%
15.8%
14.1%
Source: RHO Projectio
Note: Exit multiple applied to Core EBITDA of $271 million and Core NOT of $302
56 million reflects estimate for cost savings.
Potential buyer and seller transaction costs
12.5%
8.0%
21.2%
19.0%
17.1%
15.4%
13.8%
14.0x
7.7%
22.5%
20.3%
18.4%
16.6%
15.0%
Preliminary, Subject to Further Review and Revision
Bank of America
Merrill Lynch
Exit Multiple
Exit Cap Rate
Illustrative Price
Illustrative Price
$17.00
$18.50
$20.00
$21.50
$23.00
Exit Multiple
Exit Cap Rate
$17.00
Unlevered IRR Sensitivity
12.0x
$23.00
9.0%
9.3%
8.5%
7,8%
7.1%
6.4%
12.0x
9.0%
18.3%
$18.50 16.0%
$20.00 13.9%
$21.50 12.0%
12.5x
10.3%
8.7%
10.1%
9.3%
8.6%
7.9%
7.2%
125x
8.7%
19.9%
17.6%
15.5%
Levered IRR Sensitivity (With $100 Incremental Debt)
13.6%
13.0x
11.9%
8.3%
10.8%
10.1%
9.3%
8.6%
7.9%
13.0x
8.3%
21.4%
19.1%
17.0%
15.0%
135x
13.3%
8.0%
11.5%
10.8%
10.0%
9.3%
8.6%
135x
8.0%
22.9%
20.5%
18.4%
16.4%
14.7%
14.0x
7.7%
12.3%
11.5%
10.7%
10.0%
9.3%
14.0x
7.7%
24.3%
21.9%
19.7%
17.8%
16.0%View entire presentation