MP Materials Investor Conference Presentation Deck
1.
2.
Continued
operational
execution
■
2021
2022
Stage II Related
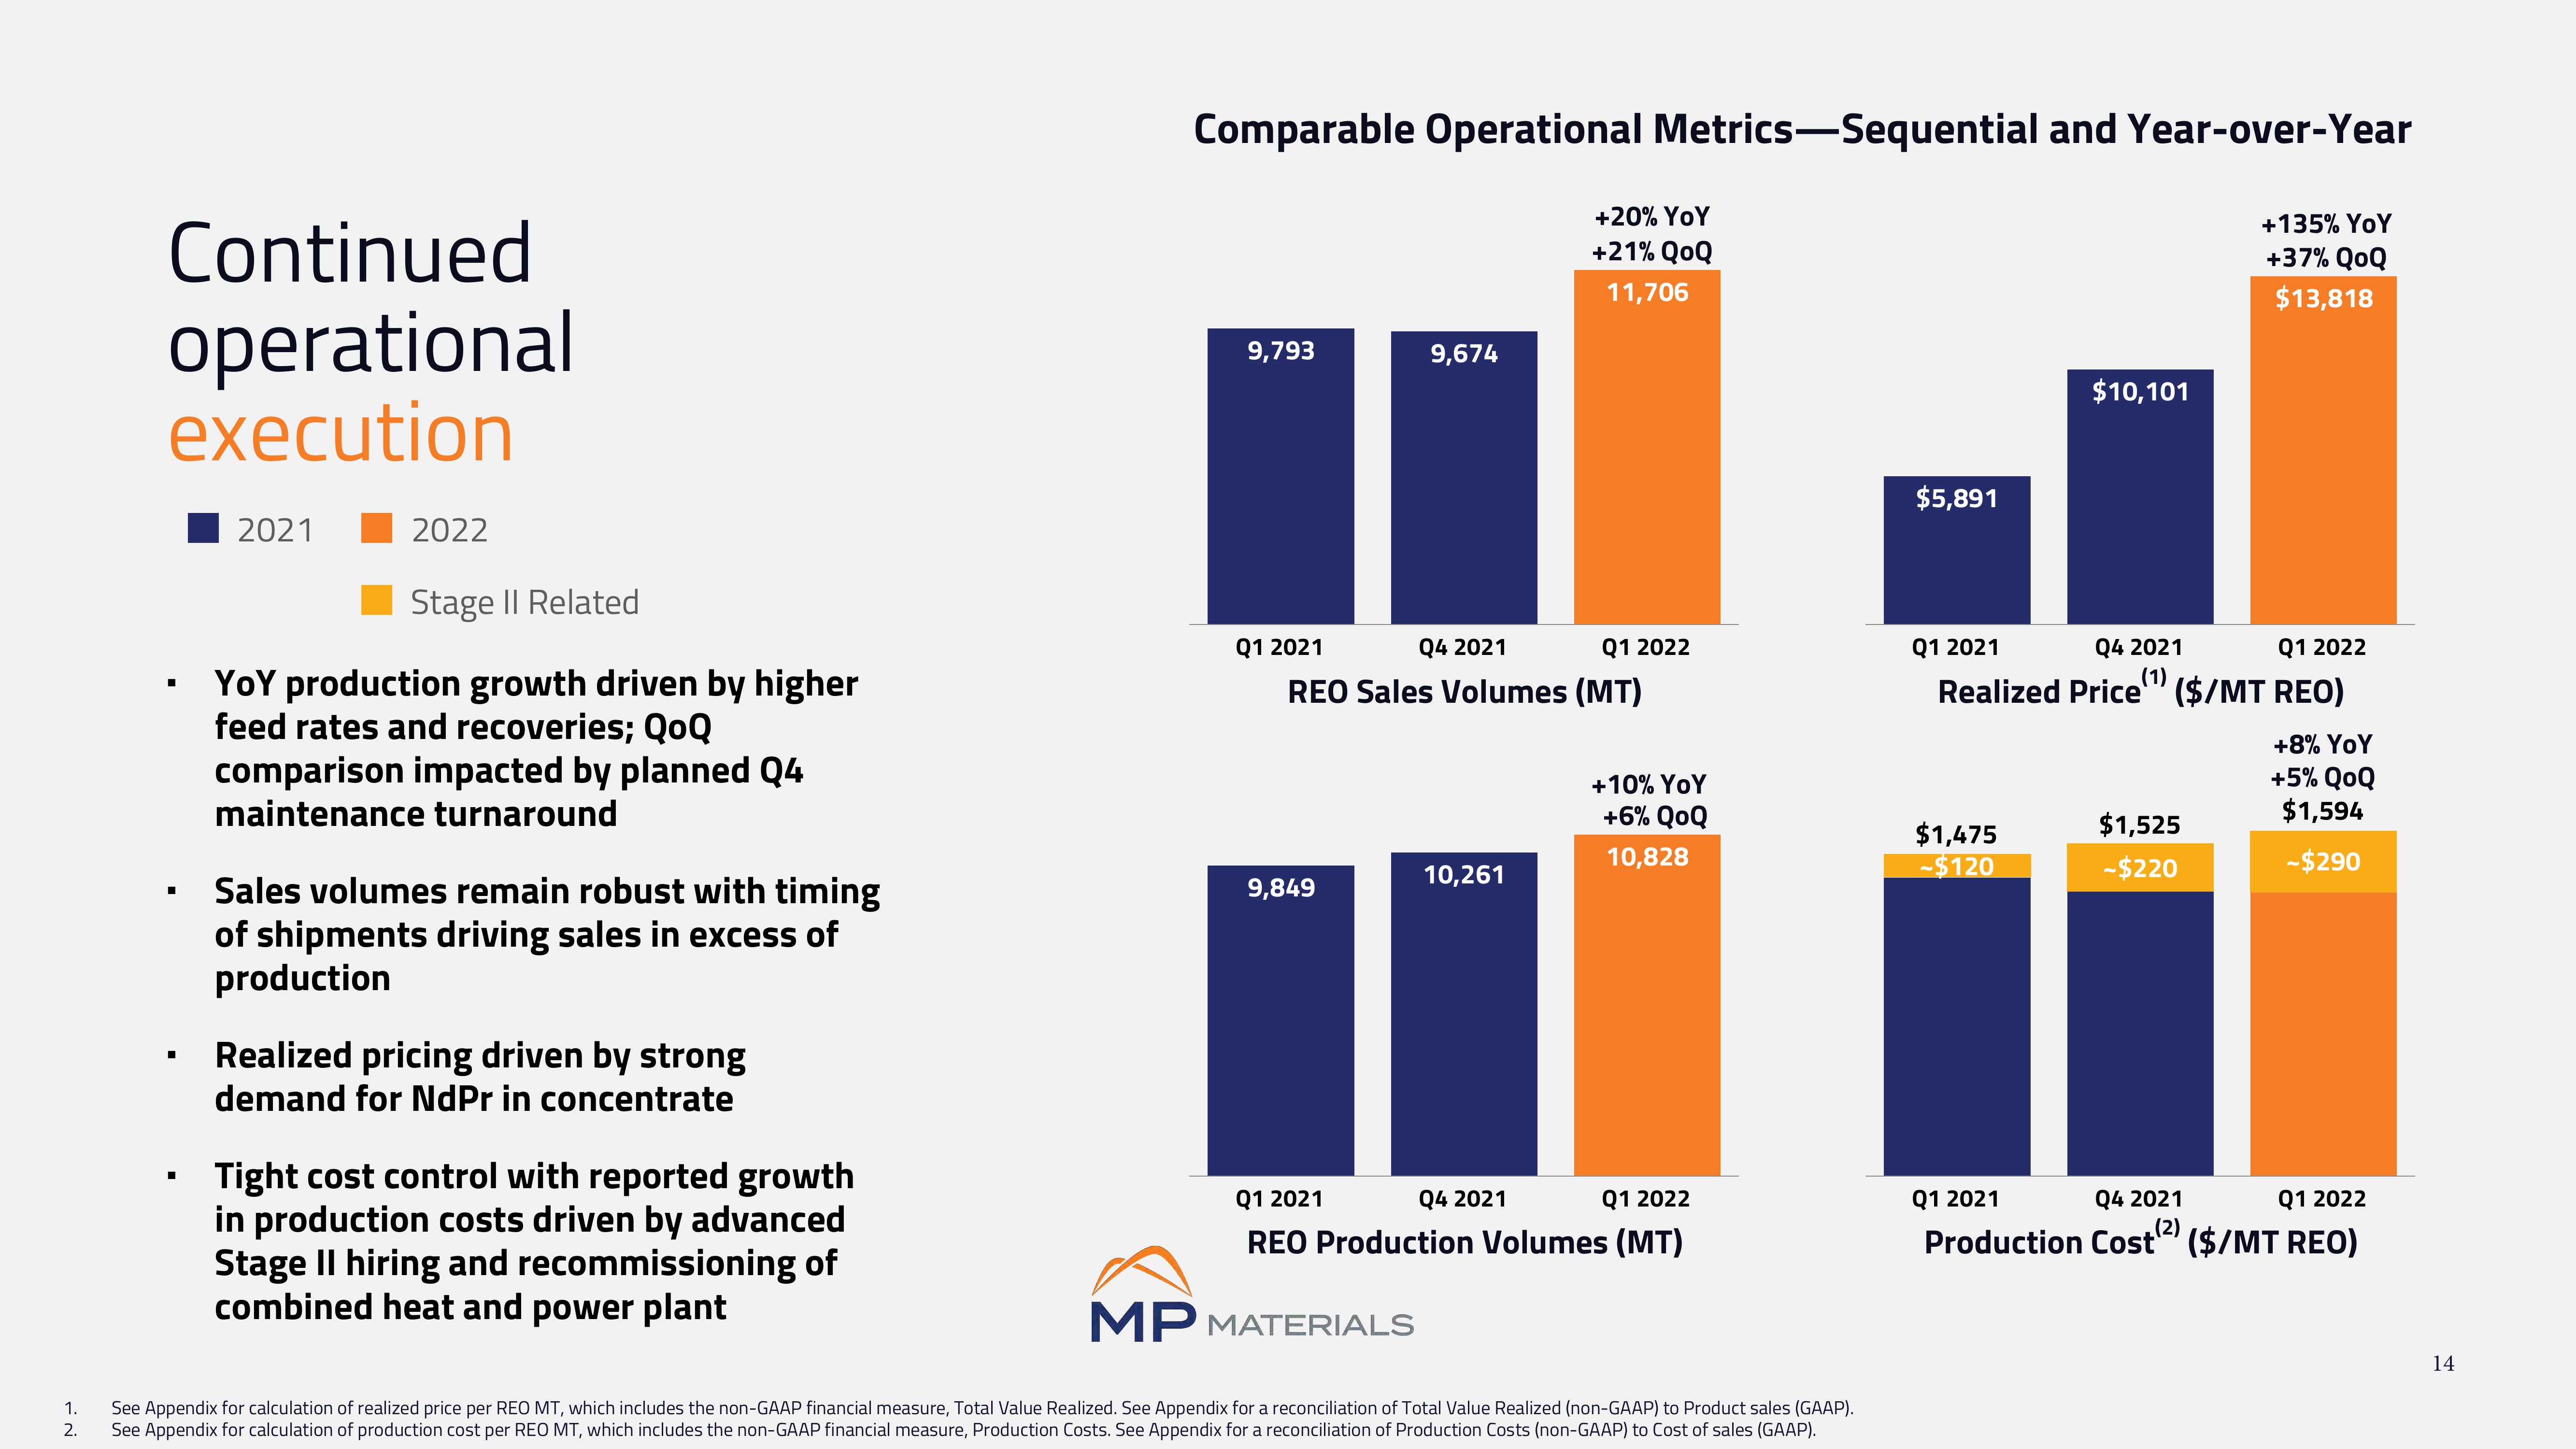
YoY production growth driven by higher
feed rates and recoveries; QoQ
comparison impacted by planned Q4
maintenance turnaround
Sales volumes remain robust with timing
of shipments driving sales in excess of
production
Realized pricing driven by strong
demand for NdPr in concentrate
Tight cost control with reported growth
in production costs driven by advanced
Stage II hiring and recommissioning of
combined heat and power plant
Comparable Operational Metrics-Sequential and Year-over-Year
+135% YoY
+37% QOQ
$13,818
9,793
Q1 2021
9,674
Q4 2021
REO Sales Volumes (MT)
9,849
+20% YoY
+21% QOQ
11,706
10,261
Q1 2022
+10% YoY
+6% QOQ
10,828
Q1 2021
Q4 2021
Q1 2022
REO Production Volumes (MT)
MP MATERIALS
See Appendix for calculation of realized price per REO MT, which includes the non-GAAP financial measure, Total Value Realized. See Appendix for a reconciliation of Total Value Realized (non-GAAP) to Product sales (GAAP).
See Appendix for calculation of production cost per REO MT, which includes the non-GAAP financial measure, Production Costs. See Appendix for a reconciliation of Production Costs (non-GAAP) to Cost of sales (GAAP).
$5,891
$10,101
Q1 2021
Q1 2022
Q4 2021
(1)
Realized Price ($/MT REO)
$1,475
-$120
$1,525
-$220
+8% YoY
+5% QOQ
$1,594
-$290
Q1 2021
Q4 2021
Q1 2022
Production Cost ($/MT REO)
14View entire presentation