JD Sports Results Presentation Deck
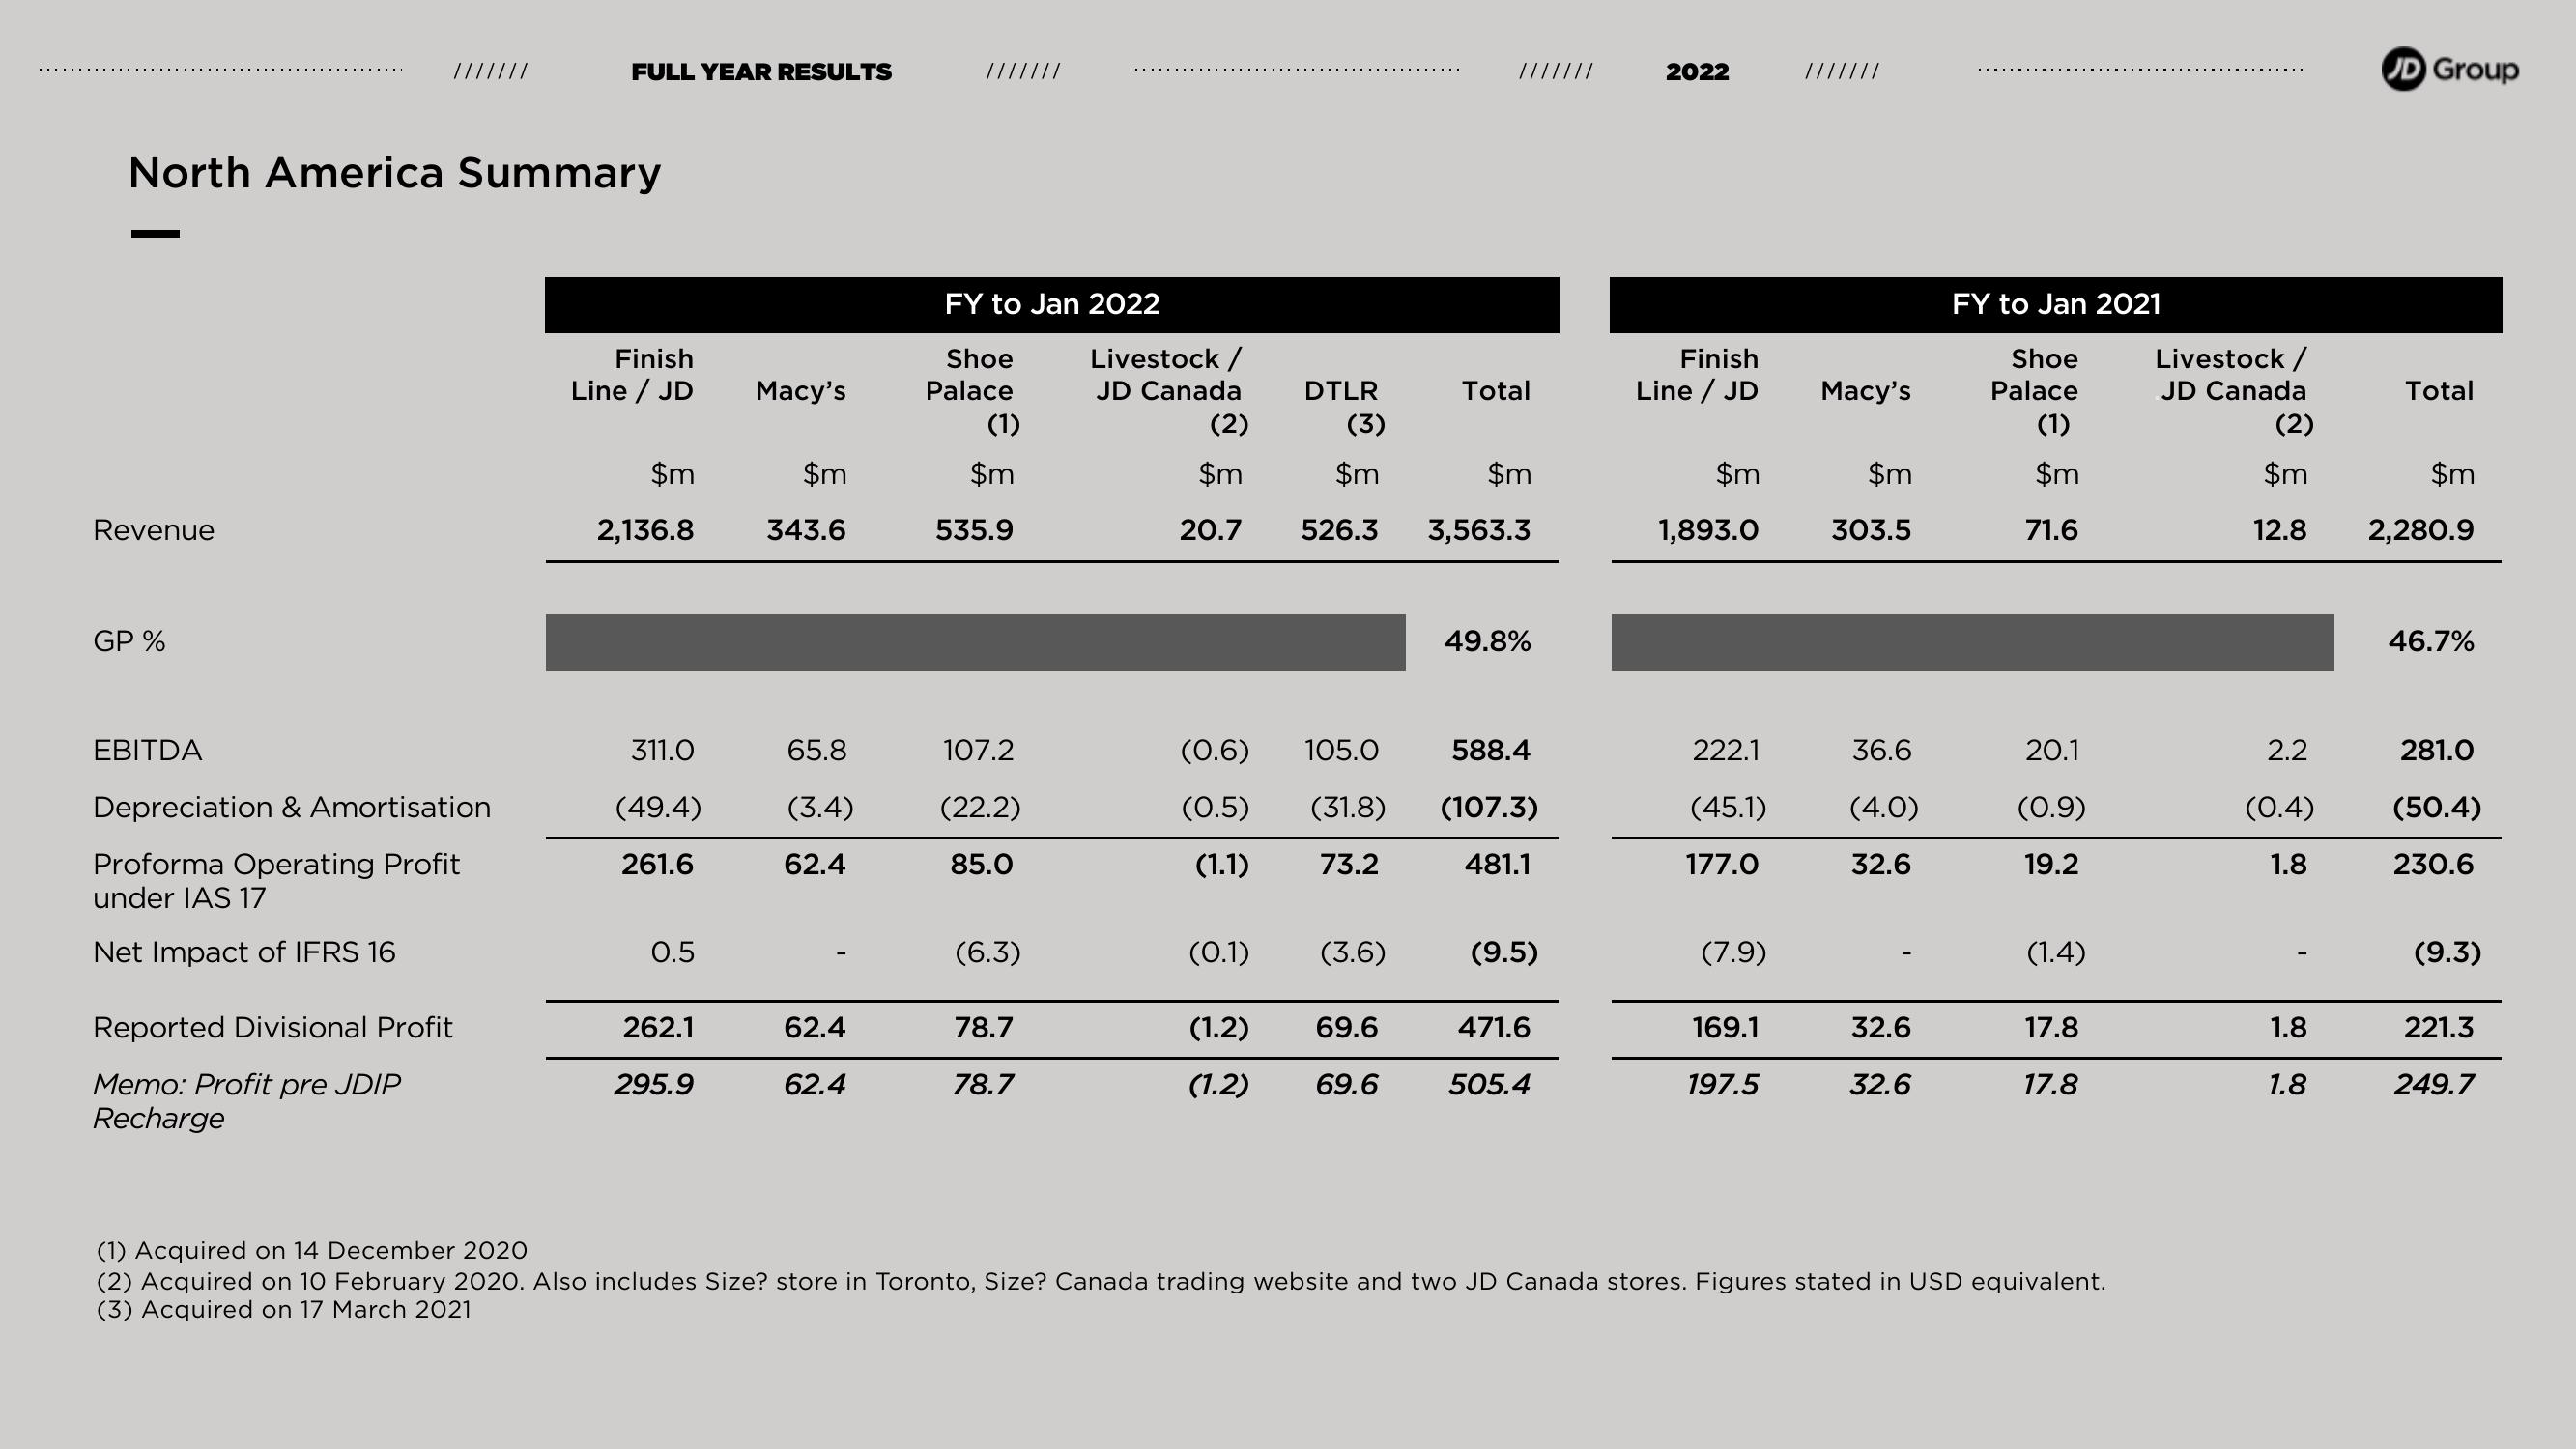
North America Summary
Revenue
GP %
EBITDA
Depreciation & Amortisation
Proforma Operating Profit
under IAS 17
Net Impact of IFRS 16
FULL YEAR RESULTS
Reported Divisional Profit
Memo: Profit pre JDIP
Recharge
Finish
Line / JD Macy's
$m
2,136.8
311.0
(49.4)
261.6
0.5
262.1
295.9
$m
343.6
65.8
(3.4)
62.4
62.4
62.4
FY to Jan 2022
Shoe
Palace
(1)
$m
535.9
107.2
(22.2)
85.0
(6.3)
78.7
78.7
Livestock /
JD Canada
(2)
$m
$m
$m
20.7 526.3 3,563.3
DTLR
(0.1)
(3)
(0.6)
105.0
588.4
(0.5) (31.8) (107.3)
(1.1)
73.2
481.1
(3.6)
Total
(1.2) 69.6
(1.2) 69.6
49.8%
(9.5)
471.6
505.4
2022
Finish
Line / JD
$m
1,893.0
222.1
(45.1)
177.0
(7.9)
169.1
197.5
///////
Macy's
$m
303.5
36.6
(4.0)
32.6
32.6
32.6
FY to Jan 2021
Shoe
Palace
(1)
$m
71.6
20.1
(0.9)
19.2
(1.4)
17.8
17.8
(1) Acquired on 14 December 2020
(2) Acquired on 10 February 2020. Also includes Size? store in Toronto, Size? Canada trading website and two JD Canada stores. Figures stated in USD equivalent.
(3) Acquired on 17 March 2021
Livestock /
JD Canada
(2)
$m
12.8
2.2
(0.4)
1.8
1.8
1.8
JD Group
Total
$m
2,280.9
46.7%
281.0
(50.4)
230.6
(9.3)
221.3
249.7View entire presentation