Carlyle Investor Day Presentation Deck
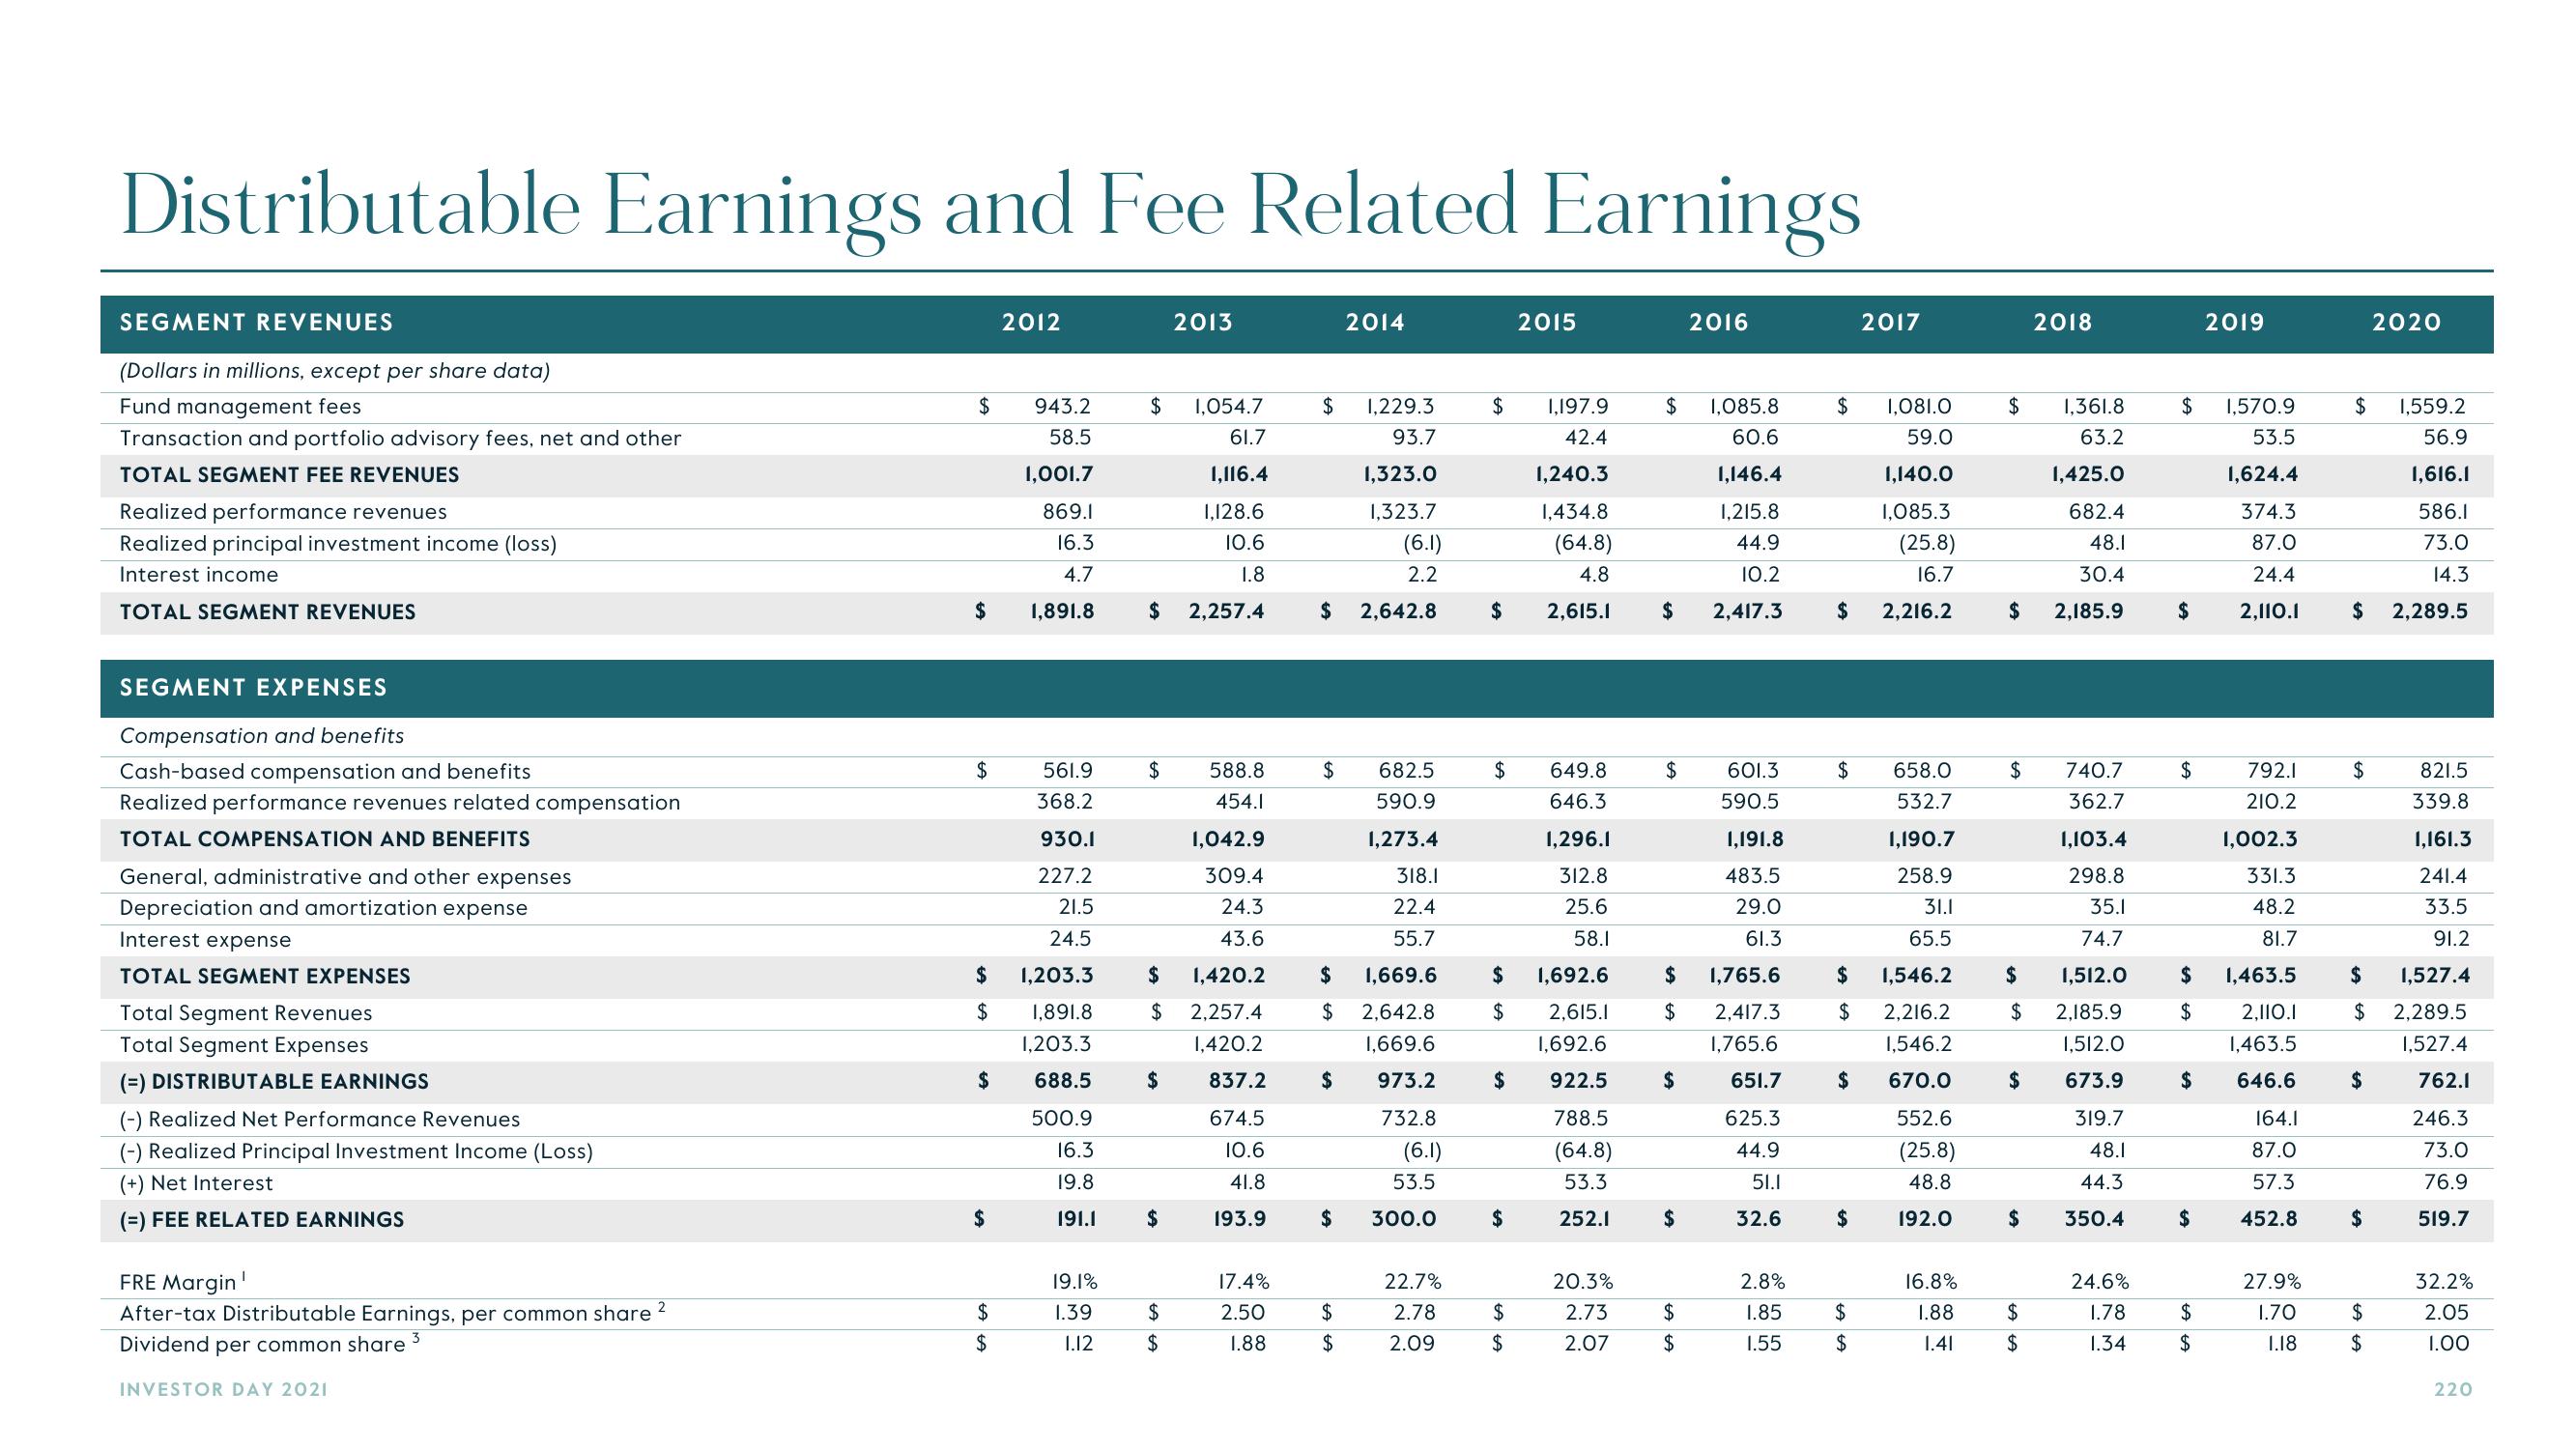
Distributable Earnings and Fee Related Earnings
SEGMENT REVENUES
(Dollars in millions, except per share data)
Fund management fees
Transaction and portfolio advisory fees, net and other
TOTAL SEGMENT FEE REVENUES
Realized performance revenues
Realized principal investment income (loss)
Interest income
TOTAL SEGMENT REVENUES
SEGMENT EXPENSES
Compensation and benefits
Cash-based compensation and benefits
Realized performance revenues related compensation
TOTAL COMPENSATION AND BENEFITS
General, administrative and other expenses
Depreciation and amortization expense
Interest expense
TOTAL SEGMENT EXPENSES
Total Segment Revenues
Total Segment Expenses
(=) DISTRIBUTABLE EARNINGS
(-) Realized Net Performance Revenues
(-) Realized Principal Investment Income (Loss)
(+) Net Interest
(=) FEE RELATED EARNINGS
FRE Margin
After-tax Distributable Earnings, per common share 2
Dividend per common share ³
INVESTOR DAY 2021
$ 943.2
58.5
1,001.7
869.1
16.3
4.7
1,891.8
$
$
$
$
$
$
2012
$
561.9
368.2
930.1
227.2
21.5
24.5
1,203.3
1,891.8
1,203.3
688.5
500.9
16.3
19.8
191.1
19.1%
1.39
1.12
$ 1,054.7
61.7
1,116.4
1,128.6
10.6
1.8
$ 2,257.4
$
588.8
454.1
1,042.9
309.4
24.3
43.6
$ 1,420.2
$ 2,257.4
1,420.2
837.2
674.5
10.6
41.8
193.9
$
2013
$
$
$
17.4%
2.50
1.88
$
1,229.3
93.7
1,323.0
1,323.7
(6.1)
2.2
$ 2,642.8
$
2014
$
318.1
22.4
55.7
1,669.6
$
$ 2,642.8
1,669.6
973.2
732.8
(6.1)
682.5
590.9
1,273.4
$
$
53.5
$ 300.0
22.7%
2.78
2.09
$
$
$
$
$
$
$
$
$
2015
1,197.9
42.4
1,240.3
1,434.8
(64.8)
4.8
2,615.1
649.8
646.3
1,296.1
312.8
25.6
58.1
1,692.6
2,615.1
1,692.6
922.5
788.5
(64.8)
53.3
252.1
20.3%
2.73
2.07
$ 1,085.8
60.6
1,146.4
1,215.8
44.9
10.2
2,417.3
$
$
$
2016
$
$ 1,765.6
$ 2,417.3
1,765.6
651.7
625.3
44.9
51.1
32.6
$
$
601.3
590.5
1,191.8
483.5
29.0
61.3
2.8%
1.85
1.55
$
$
$
$
$
$
$
$
2017
1,081.0
59.0
1,140.0
1,085.3
(25.8)
16.7
2,216.2
658.0
532.7
1,190.7
258.9
31.1
65.5
1,546.2
2,216.2
1,546.2
670.0
552.6
(25.8)
48.8
192.0
16.8%
1.88
1.41
$ 1,361.8
63.2
1,425.0
682.4
48.1
30.4
2,185.9
$
$
$
$
2018
1,103.4
298.8
35.1
74.7
1,512.0
2,185.9
1,512.0
$ 673.9
319.7
48.1
44.3
350.4
$
$
$
740.7
362.7
24.6%
1.78
1.34
$ 1,570.9
53.5
1,624.4
374.3
87.0
24.4
$ 2,110.1
$
$
2019
$
$ 1,463.5
$ 2,110.1
1,463.5
646.6
164.1
87.0
57.3
452.8
$
$
792.1
210.2
1,002.3
331.3
48.2
81.7
27.9%
1.70
1.18
$
$
$
$
$
$
$
$
$
2020
1,559.2
56.9
1,616.1
586.1
73.0
14.3
2,289.5
821.5
339.8
1,161.3
241.4
33.5
91.2
1,527.4
2,289.5
1,527.4
762.1
246.3
73.0
76.9
519.7
32.2%
2.05
1.00
220View entire presentation