Bird Results Presentation Deck slide image

Bird Results Presentation Deck

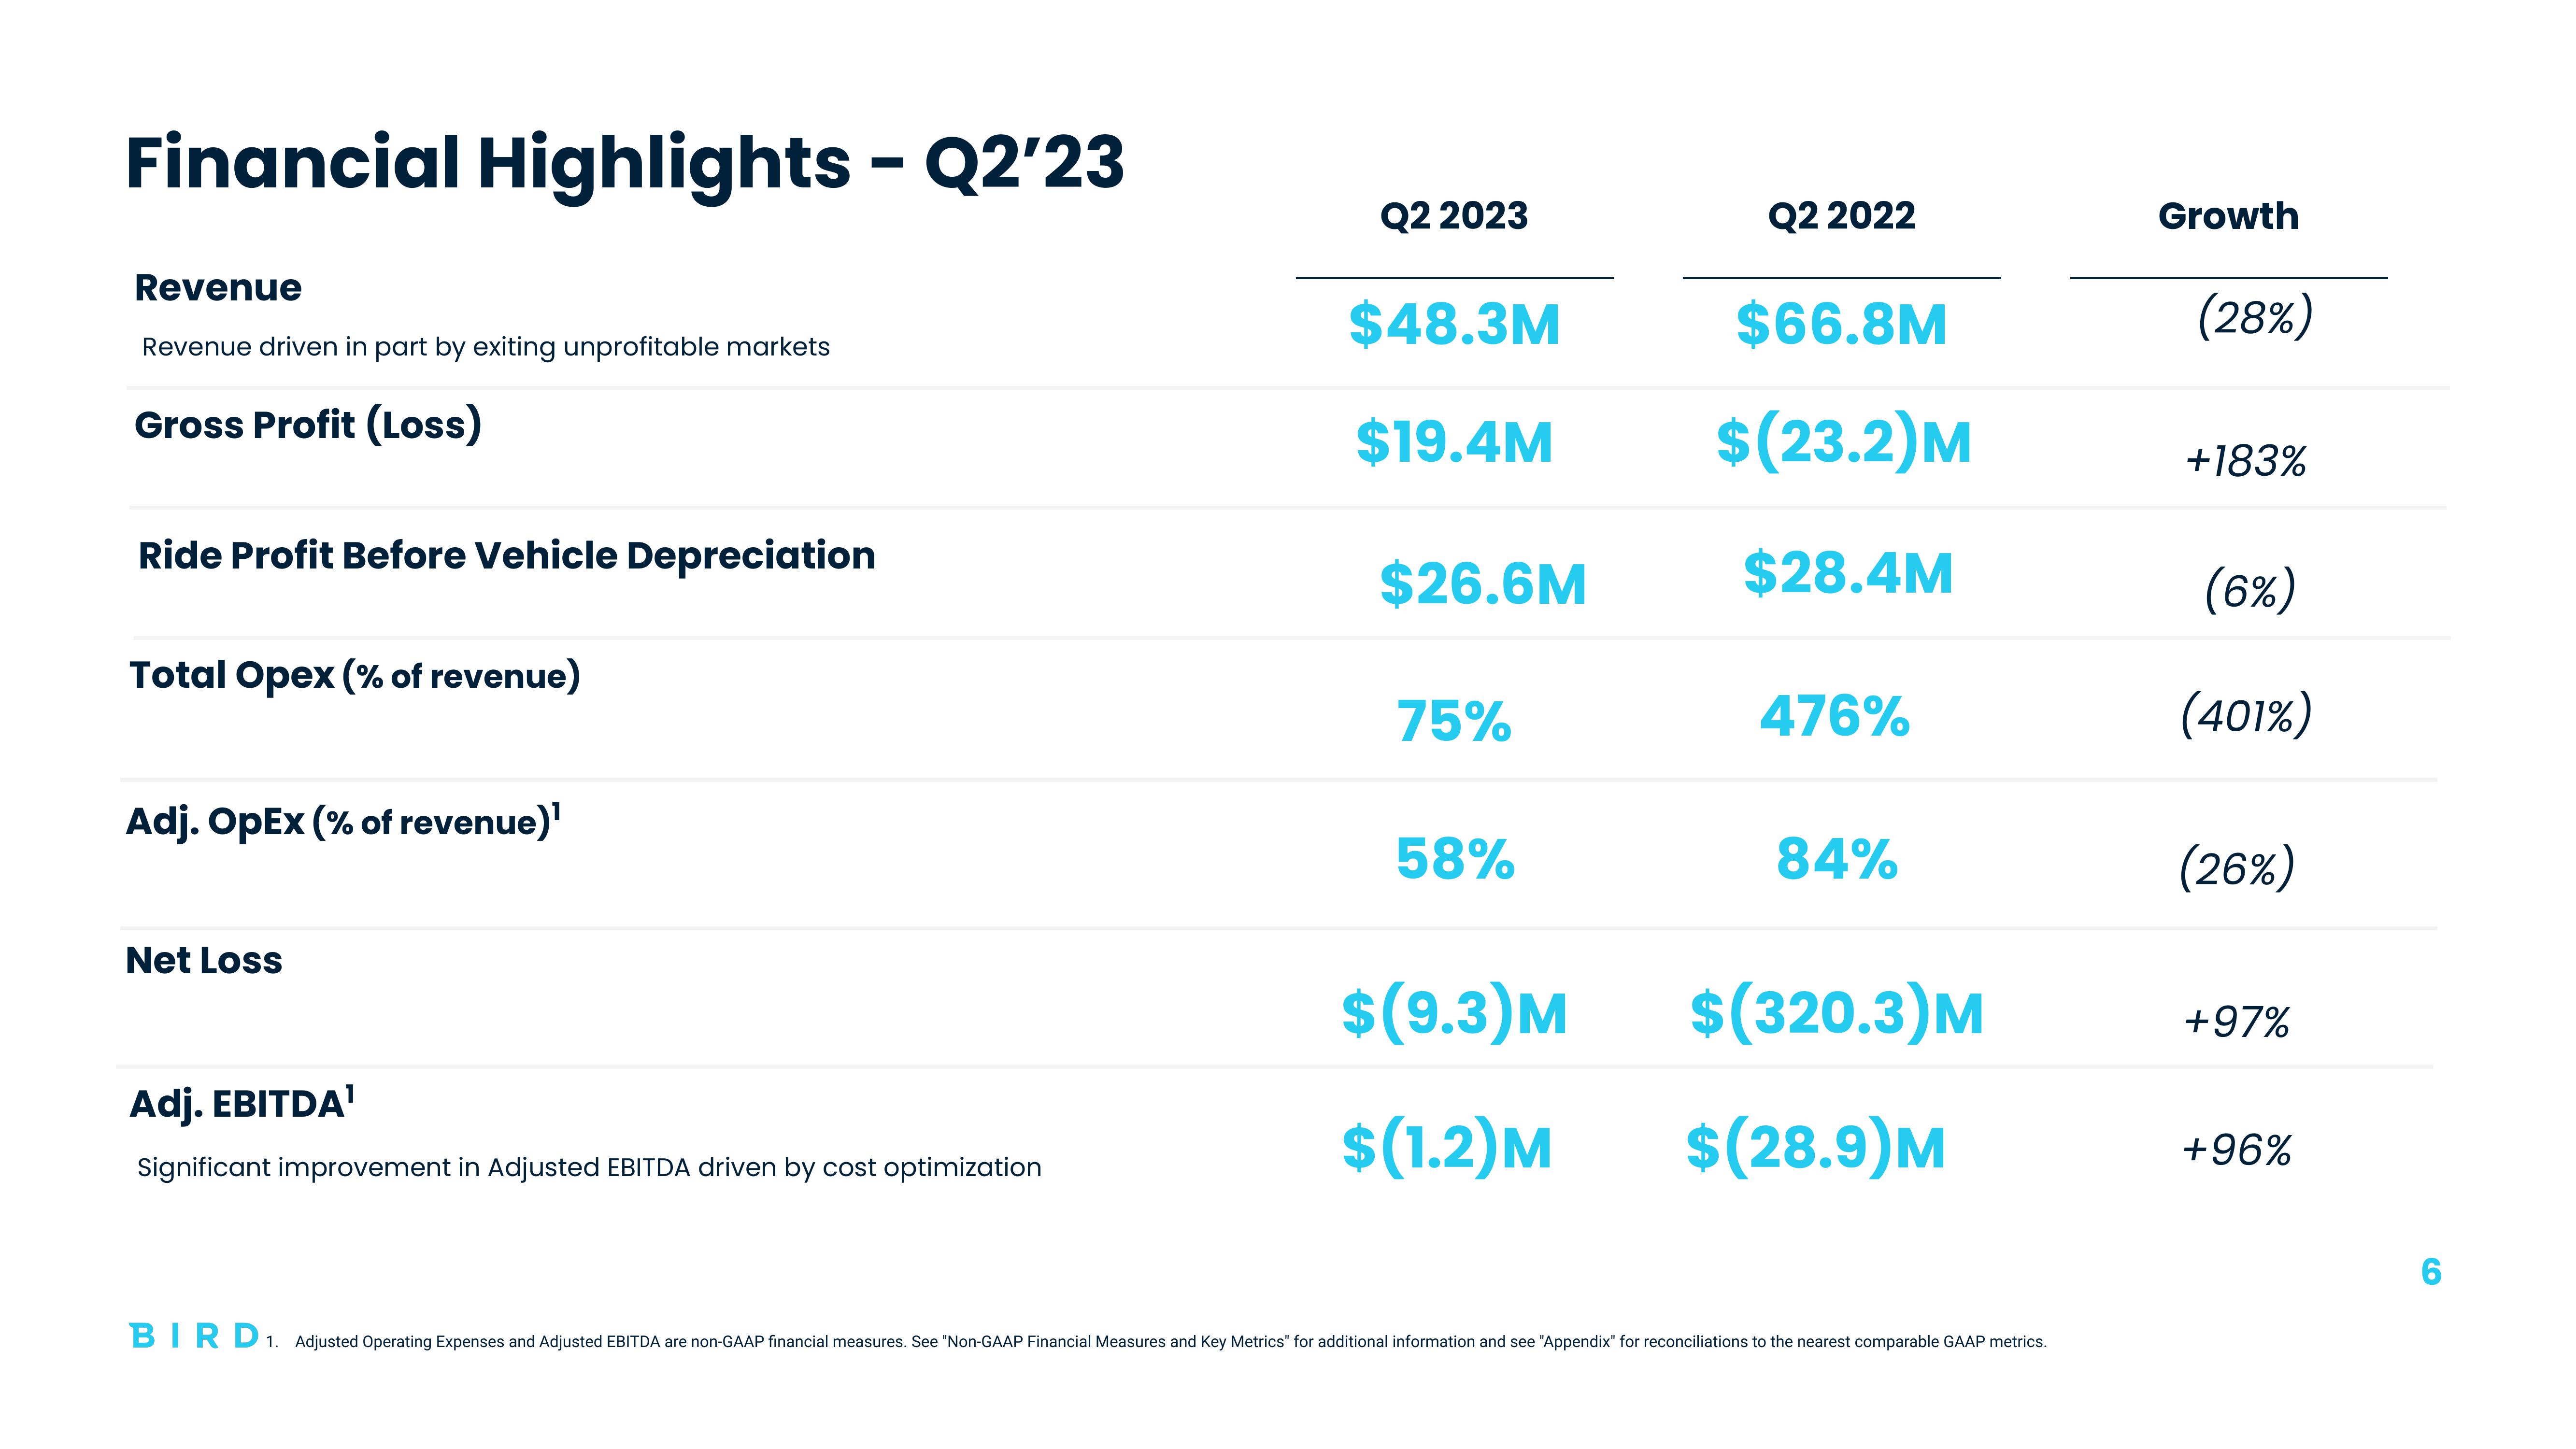
Financial Highlights - Q2'23 Revenue Revenue driven in part by exiting unprofitable markets Gross Profit (Loss) Ride Profit Before Vehicle Depreciation Total Opex (% of revenue) Adj. OpEx (% of revenue)¹ Net Loss Adj. EBITDA¹ Significant improvement in Adjusted EBITDA driven by cost optimization Q2 2023 $48.3M $19.4M $26.6M 75% 58% $(9.3) M $(1.2)M Q2 2022 $66.8M $(23.2) M $28.4M 476% 84% $(320.3) M $(28.9) M BIRD 1. Adjusted Operating Expenses and Adjusted EBITDA are non-GAAP financial measures. See "Non-GAAP Financial Measures and Key Metrics" for additional information and see "Appendix" for reconciliations to the nearest comparable GAAP metrics. Growth (28%) +183% (6%) (401%) (26%) +97% +96%
View entire presentation