Benson Hill SPAC Presentation Deck
BENSON HILL
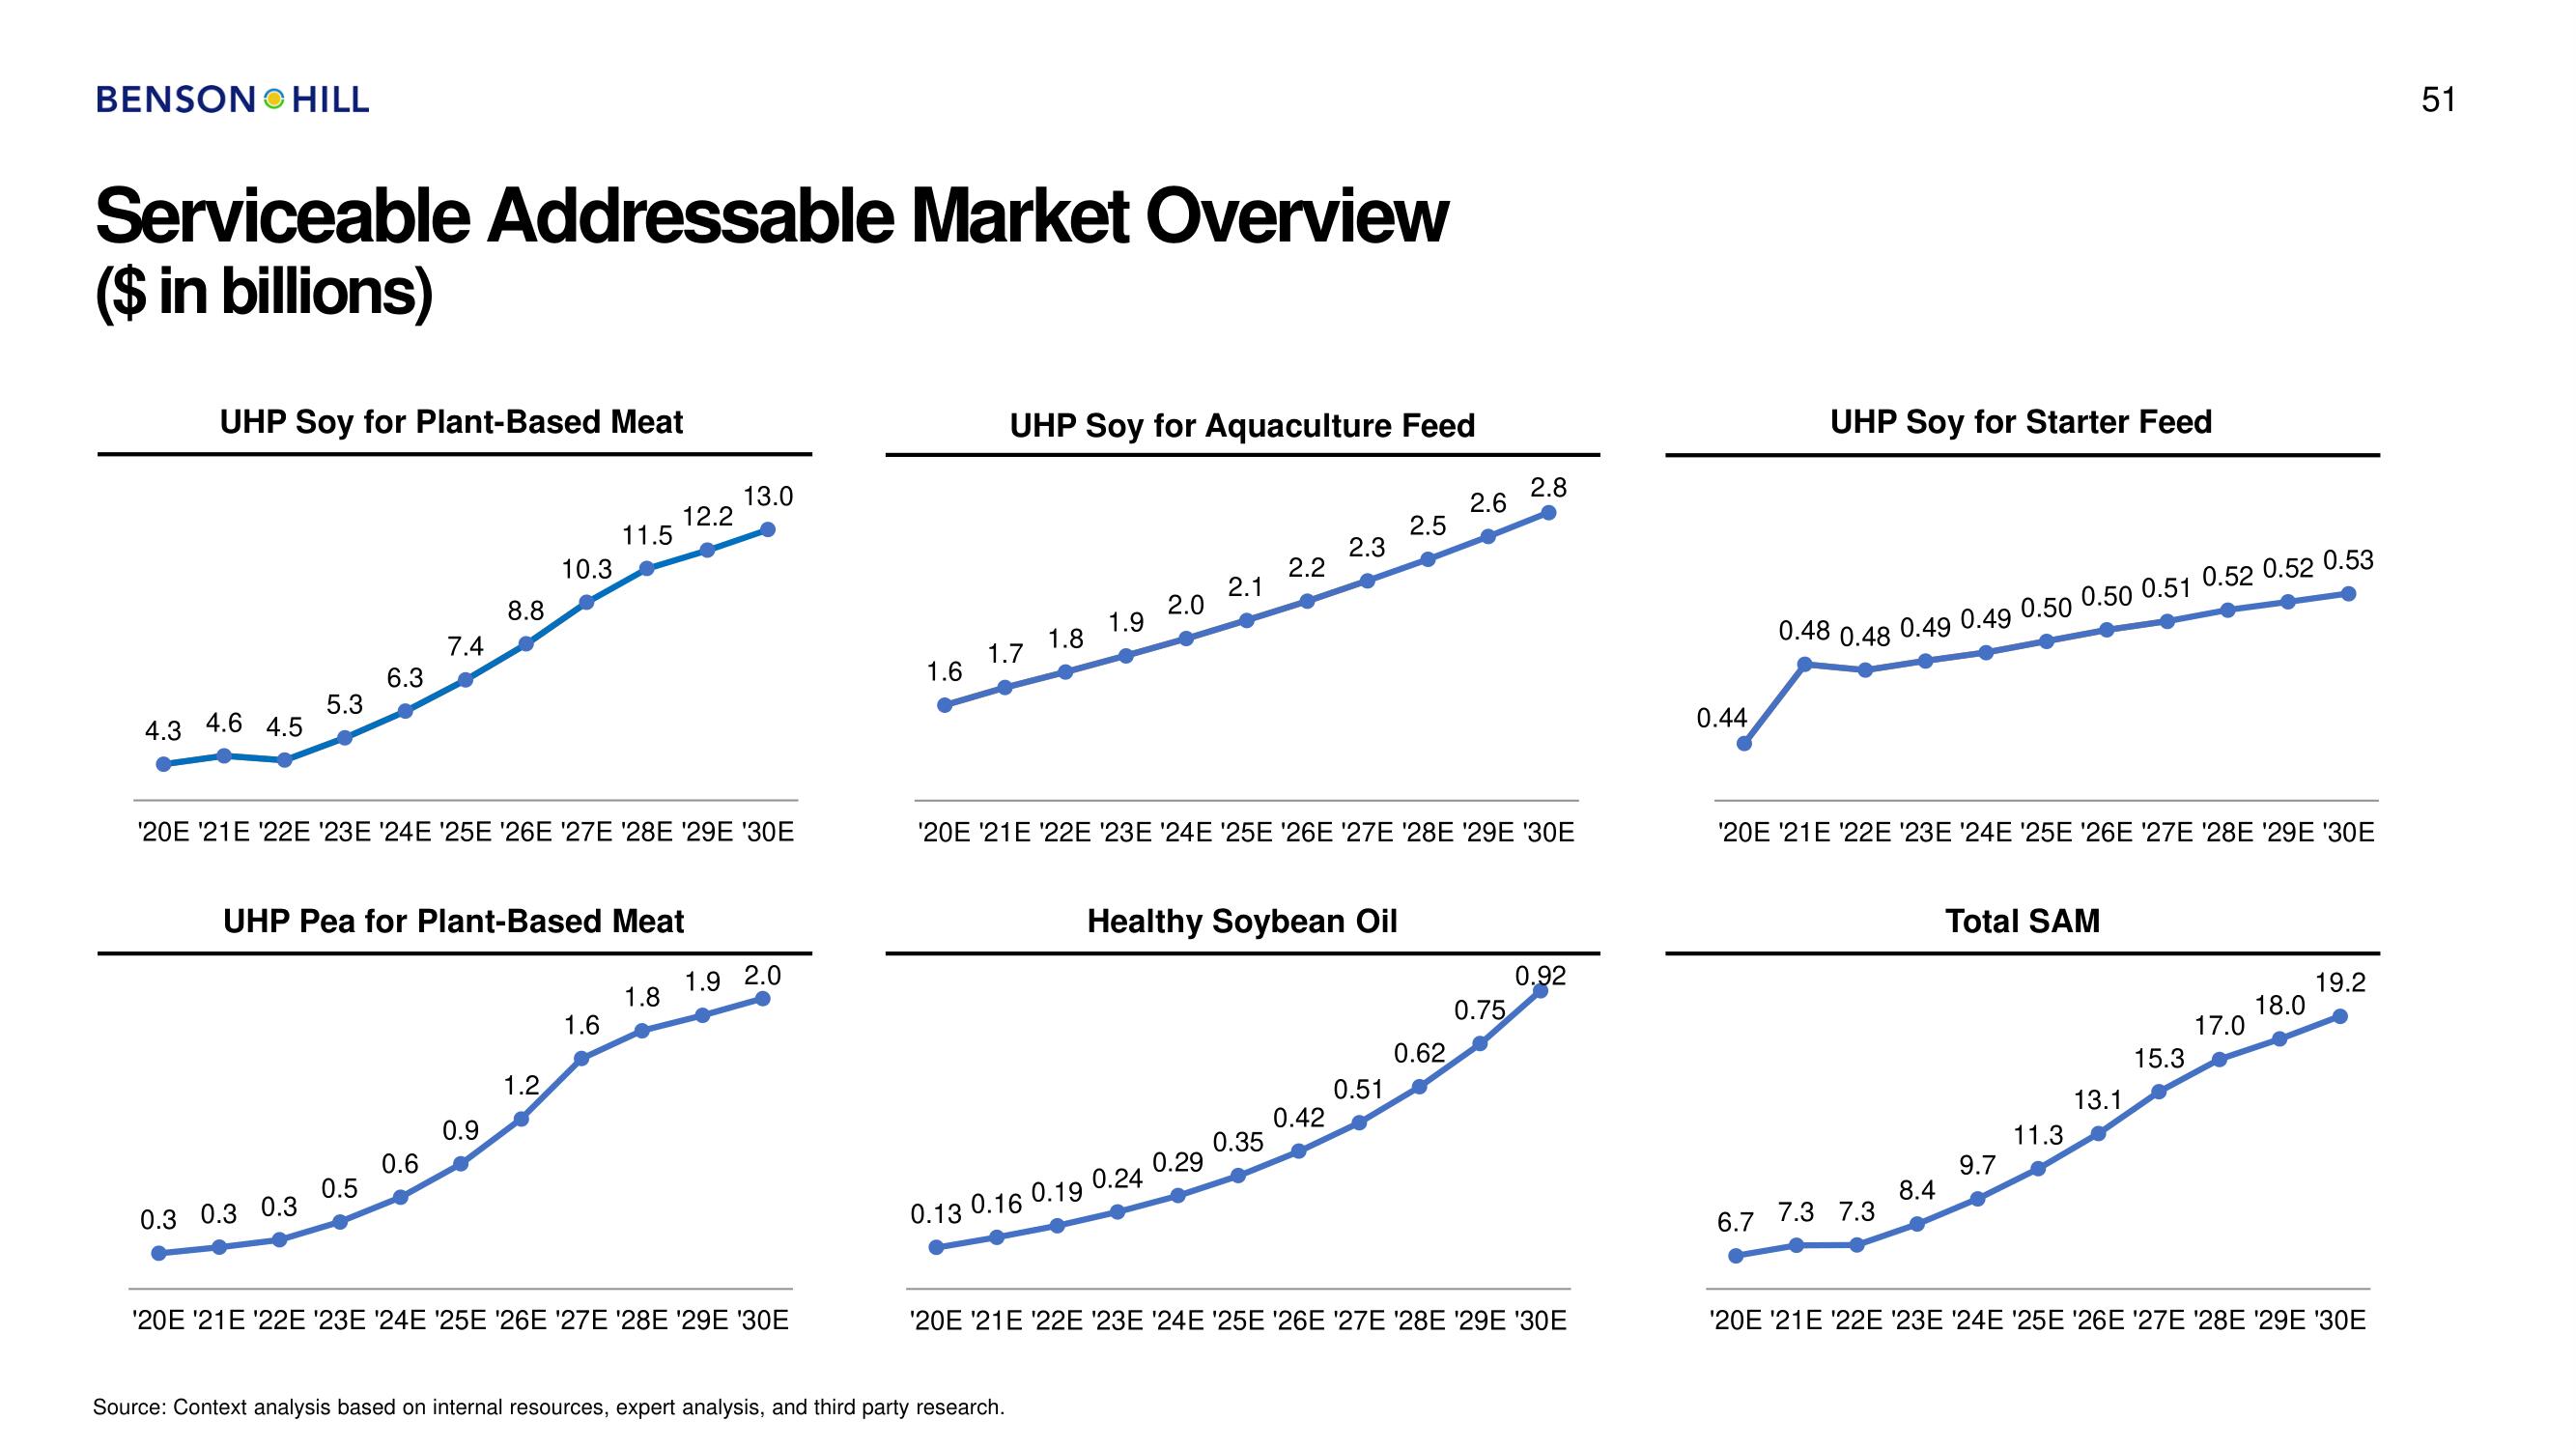
Serviceable Addressable Market Overview
($ in billions)
UHP Soy for Plant-Based Meat
4.3 4.6 4.5
5.3
0.3 0.3 0.3
6.3
0.5
7.4
0.6
8.8
'20E '21E '22E '23E '24E '25E '26E '27E '28E '29E '30E
UHP Pea for Plant-Based Meat
0.9
10.3
1.2
11.5
1.6
12.2
1.8
13.0
1.9 2.0
'20E '21E '22E '23E '24E '25E '26E '27E '28E '29E '30E
1.6
UHP Soy for Aquaculture Feed
2.1
2.0
1.7 1.8 1.9
0.13 0.16 0.19 0.24
Source: Context analysis based on internal resources, expert analysis, and third party research.
2.2
Healthy Soybean Oil
0.29
'20E '21E '22E '23E '24E '25E '26E '27E '28E '29E '30E
0.35
2.3
0.42
2.5
0.51
2.6
0.62
2.8
0.75
0.92
'20E '21E '22E '23E '24E '25E '26E '27E '28E '29E '30E
0.44
UHP Soy for Starter Feed
6.7
0.48 0.48 0.49 0.49 0.50 0.50 0.51 0.52 0.52 0.53
'20E '21E '22E '23E '24E '25E '26E '27E '28E '29E '30E
7.3 7.3
8.4
Total SAM
9.7
11.3
13.1
15.3
17.0
18.0
19.2
'20E '21E '22E '23E '24E '25E '26E '27E '28E '29E '30E
51View entire presentation