Bank of America Investment Banking Pitch Book
Price as of 3/14/2014
(2)
Price as % of 52 Wk High
Price as % of 52 Wk Low
Market Value
Enterprise Value (1¹)
Moody's Credit Rating
EV/CY 2014E EBITDA
EV/CY 2015E EBITDA
Price / CY 2014E Earnings
Price / CY 2015E Earnings 2
LT EPS Growth Rate
Net Debt / CY 2014E EBITDA
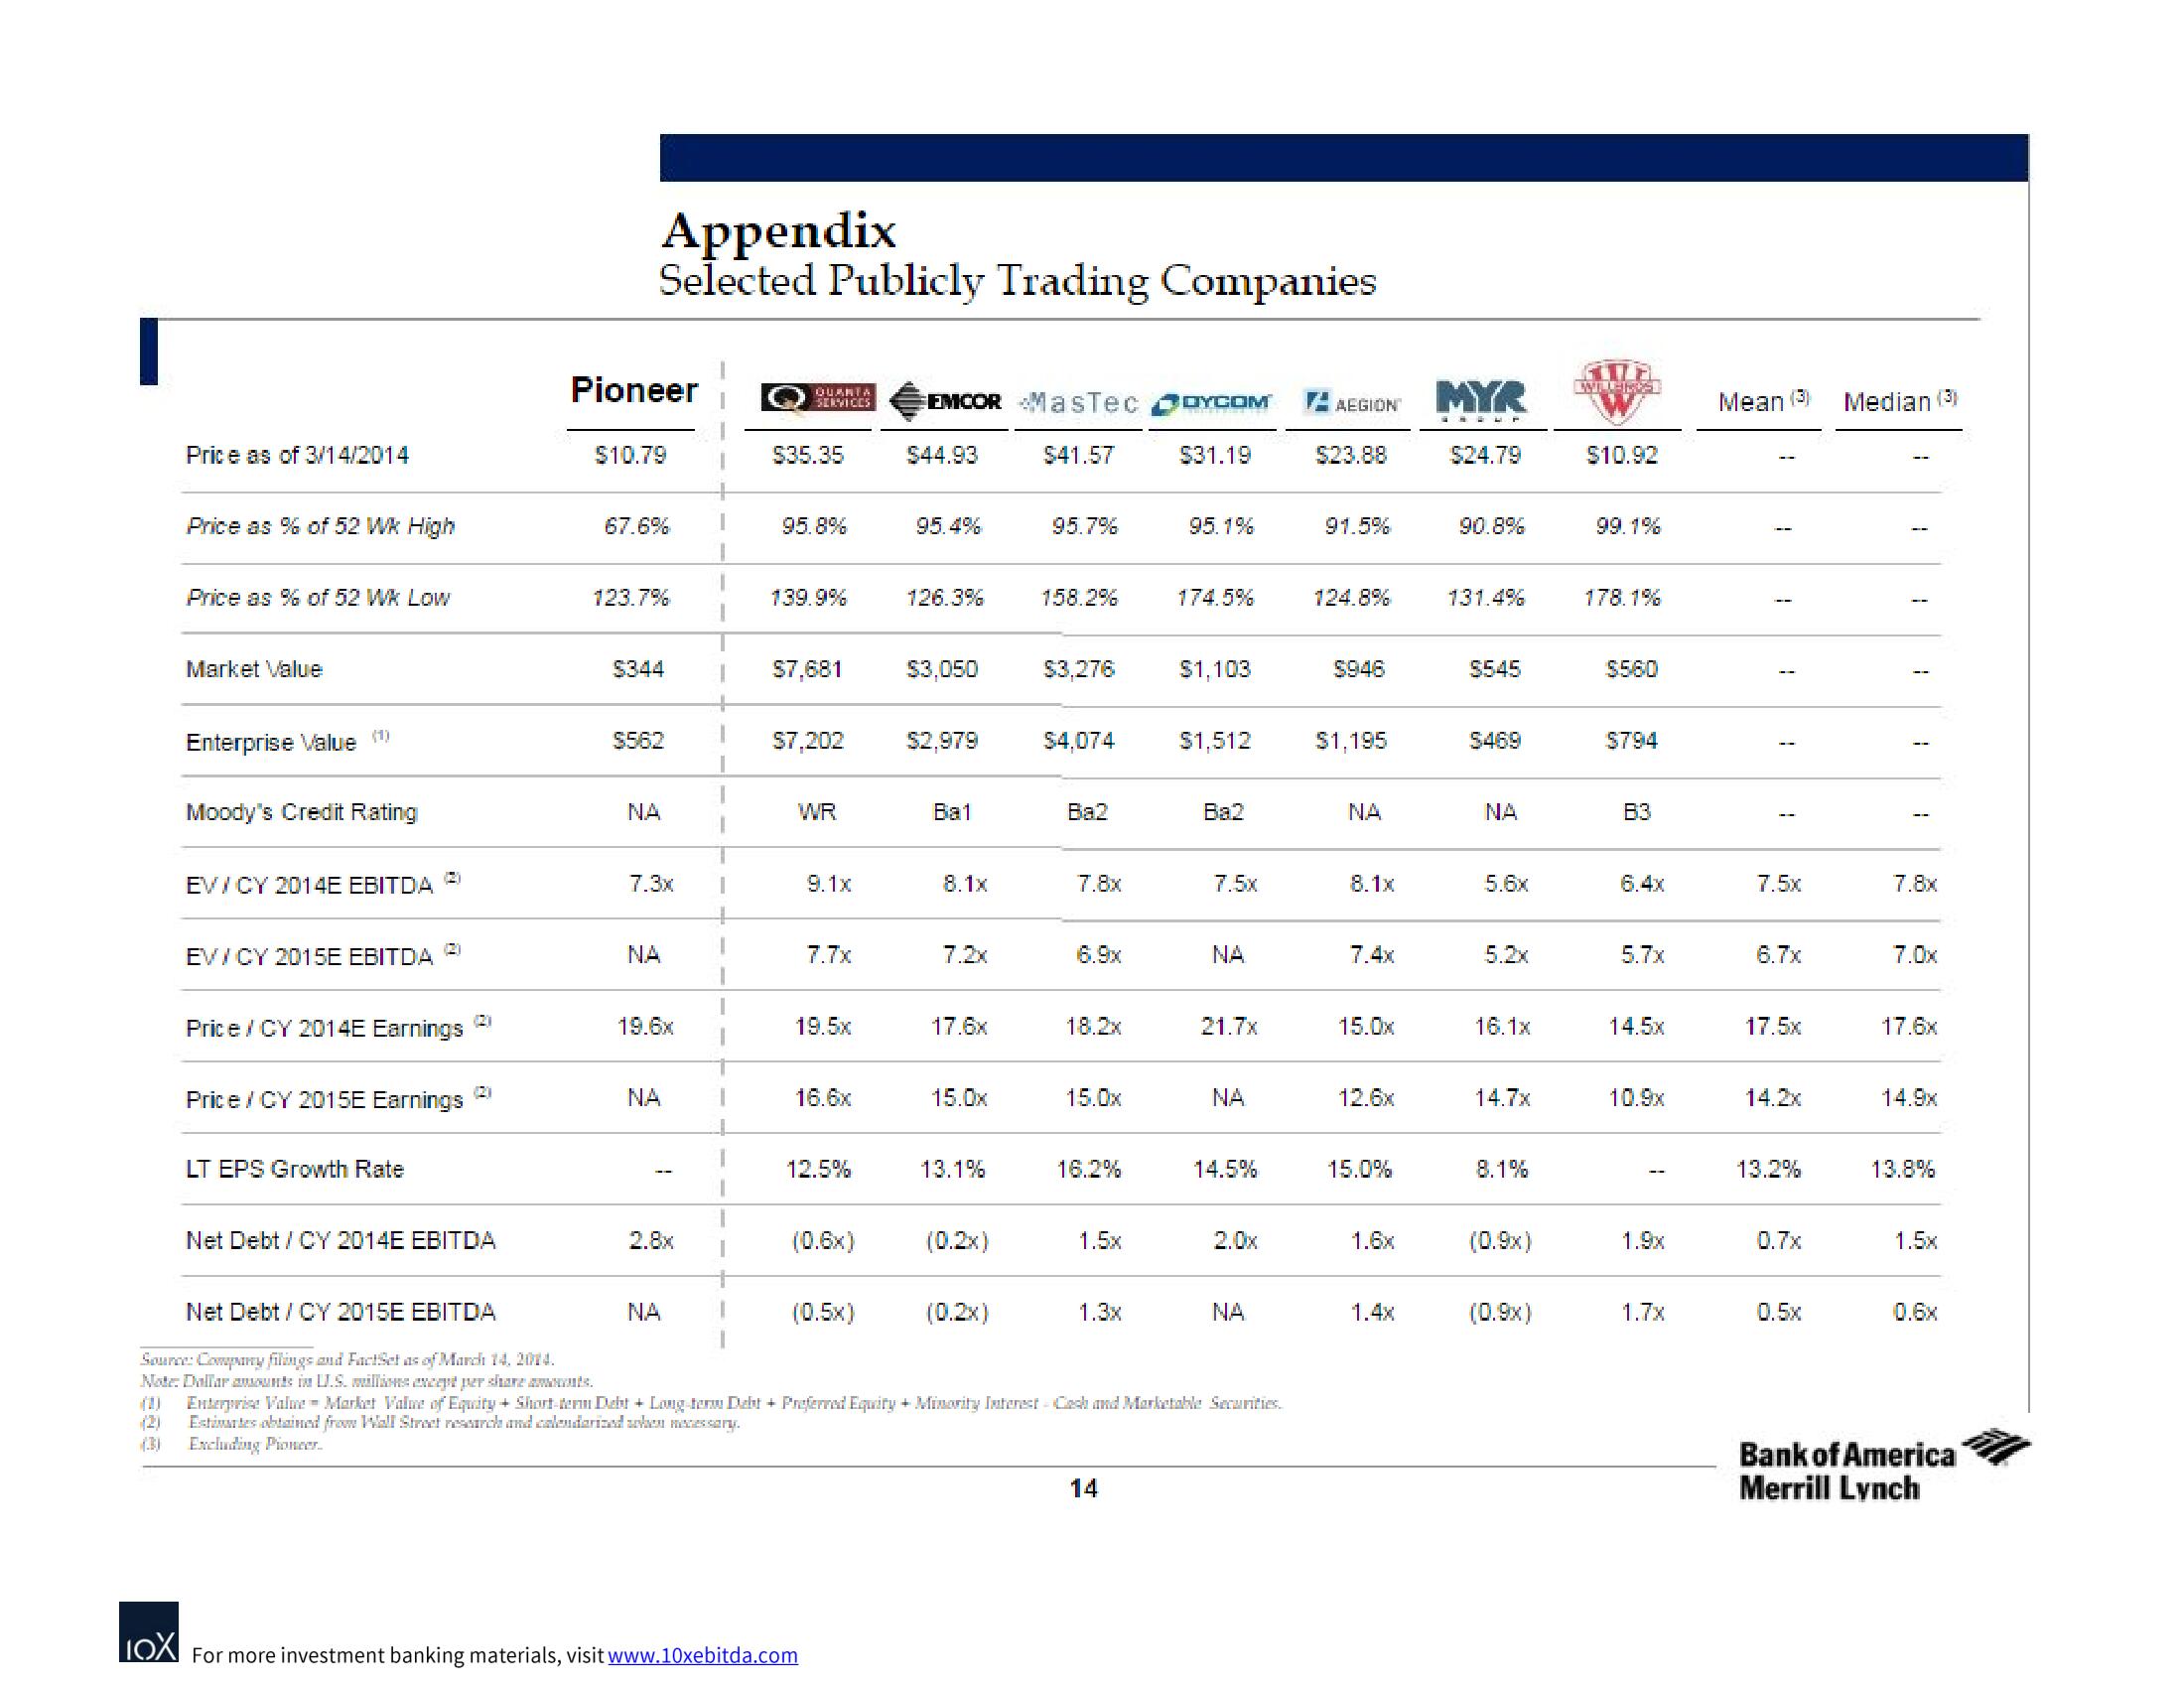
Appendix
Selected Publicly Trading Companies
Pioneer
$10.79
67.6%
123.7%
$344
$562
NA
7.3x I
NA
NA
2.8x
I
NA
QUARTA
SERVICES
$35.35
95.8%
139.9%
$7,681
$7,202
WR
9.1x
7.7x
15.Ex
16.6x
12.5%
(0.6x)
LOX For more investment banking materials, visit www.10xebitda.com
(6.5x)
EMCOR MasTec
$41.57
$44.93
95.4%
126.3%
$3,050
$2,979
Bal
8.1x
7.2x
17.6x
15.0x
13.1%
(0.2x)
95.7%
(0.2x)
158.2%
$3,276
$4,074
Ba2
7.8x
6.9x
18.2x
15.0x
16.2%
1.5x
1.3x
DYCOM
14
$31.19
95.1%
174.5%
$1,103
$1,512
Ba2
Net Debt/CY 2015E EBITDA
Source: Company filings and FactSet as of March 14, 2014.
Note: Dallar amounts in I.S. millions except per shares.
Enterprise Value - Market Value of Equity+Short-term Debt + Long-term Debt + Preferred Equity + Minority Interest - Cach and Marketable Securities.
Estimates obtained from Wall Street research and calendarized when necessary.
Excluding Pioneer.
7.5x
NA
21.7x
NA
14.5%
2.0x
NA
AEGION
$23.88
91.5%
124.8%
$946
$1,195
NA
8.1x
7.4x
15.0x
12.6x
15.0%
1.6x
1.4x
MYR
P
$24.79
90.8%
131.4%
$545
$469
NA
5.6x
5.2x
16.1x
14.7x
8.1%
(0.9x)
(0.9x)
408
WILL-IRS
$10.92
99.1%
178.1%
$560
$794
63
6.4x
5.7x
14.5x
10.9x
1.9x
1.7x
Mean (3)
1
1
1
7.5x
6.7x
17.Ex
14.2x
13.2%
0.7x
0.5x
Median (3)
T
1
1
7.8x
7.0x
17.6x
14.9x
13.8%
1.5x
0.6x
Bank of America
Merrill LynchView entire presentation