Kering Investor Presentation Deck
- REVENUE
(in €m, and comparable growth in %)
503
H1 2020
●
-
% comp.
+45%
W. Europe
N. America
Japan
APAC
ROW
Total
Retail
+45%
Retail (73% of H1 sales)
Q2
H1
+46%
+472%
+108%
+32%
+170%
+72%
Wholesale
+38%
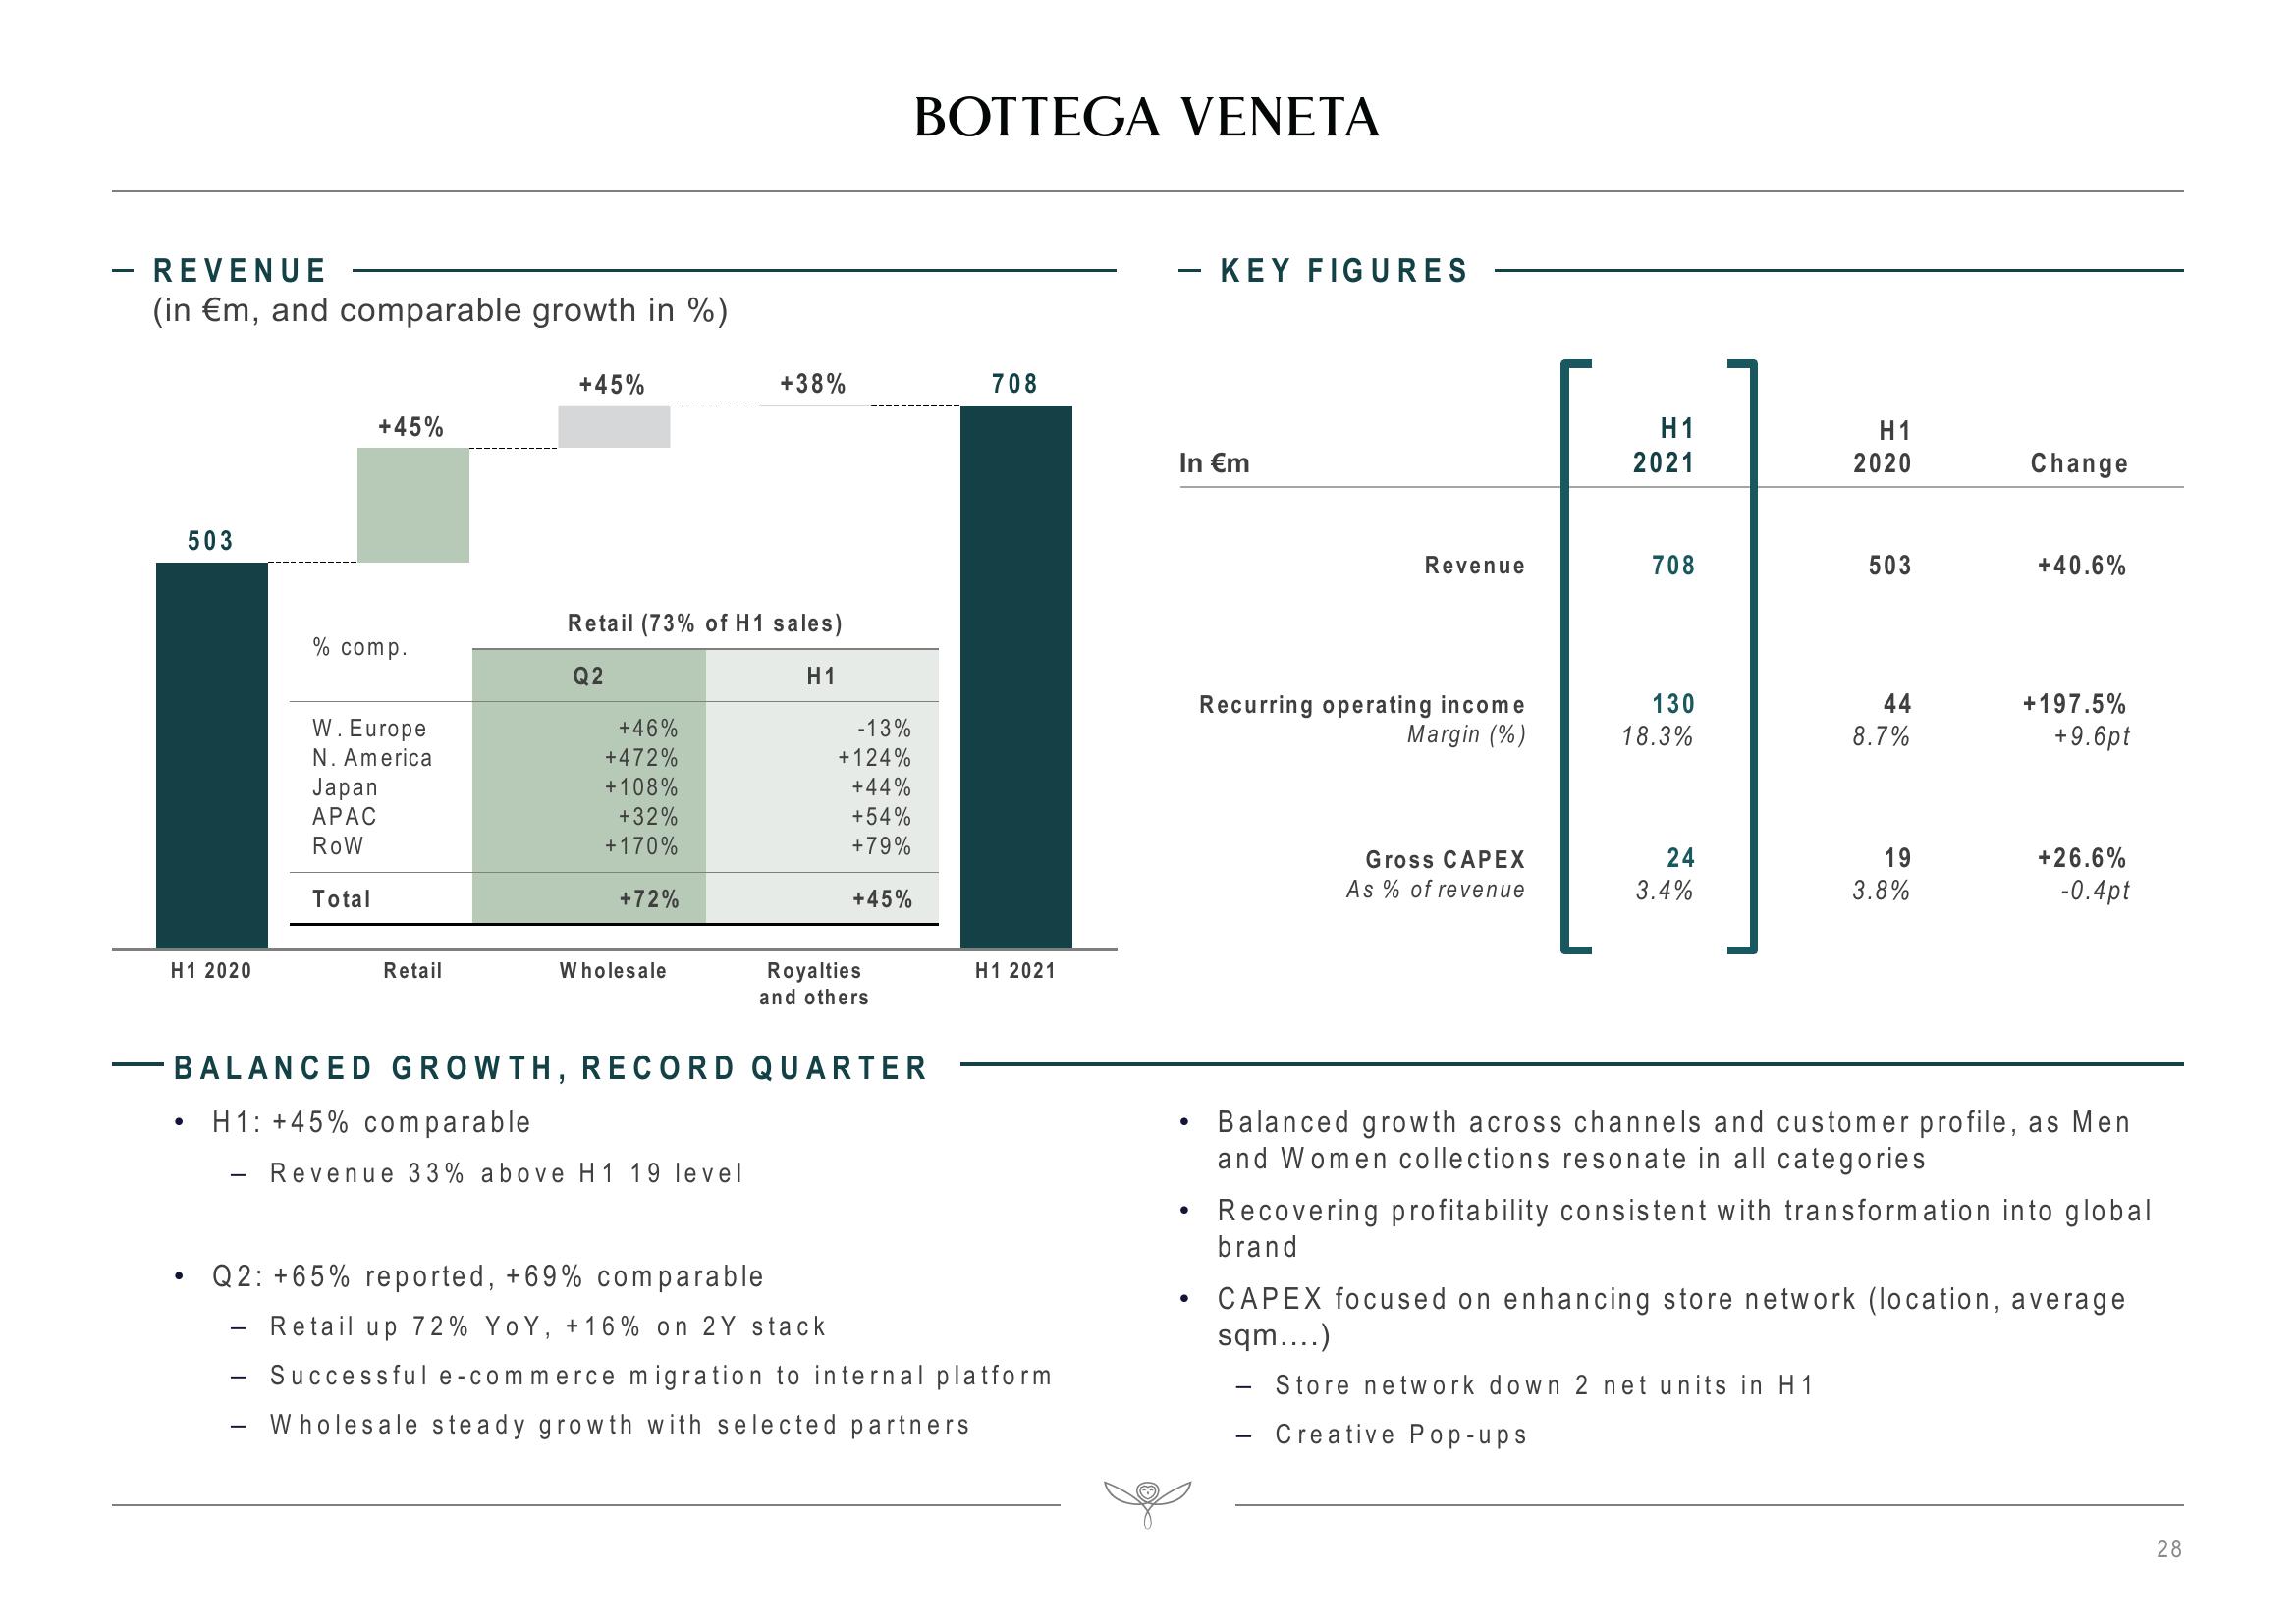
Revenue 33% above H 1 19 level
BALANCED GROWTH, RECORD QUARTER
H1: +45% comparable
-13%
+124%
+44%
+54%
+79%
+45%
Royalties
and others
Q2: +65% reported, +69% comparable
BOTTEGA VENETA
708
H1 2021
Retail up 72% YoY, +16% on 2Y stack
- Successful e-commerce migration to internal platform
- Wholesale steady growth with selected partners
- KEY FIGURES
In €m
●
Revenue
●
Recurring operating income
Margin (%)
Gross CAPEX
As % of revenue
H1
2021
708
130
18.3%
24
3.4%
H1
2020
503
44
8.7%
19
3.8%
Change
+40.6%
+197.5%
+9.6pt
Balanced growth across channels and customer profile, as Men
and Women collections resonate in all categories
Recovering profitability consistent with transformation into global
brand
●
• CAPEX focused on enhancing store network (location, average
sqm....)
Store network down 2 net units in H1
Creative Pop-ups
+26.6%
-0.4pt
28View entire presentation