J.P.Morgan Results Presentation Deck
Corporate & Investment Bank1
SELECTED INCOME STATEMENT DATA ($MM)
Revenue
Investment Banking revenue
Payments²
Lending
Total Banking
Fixed Income Markets
Equity Markets
Securities Services
Credit Adjustments & Other
Total Markets & Securities Services
Expense ²
Credit costs
Net income
KEY DRIVERS / STATISTICS ($B)³
Equity
ROE²
Overhead ratio
Comp/revenue
IB fees ($mm)
Average loans
Average client deposits
Merchant processing volume 5
Assets under custody ($T)
6
ALL/EOP loans ex-conduits and trade
Net charge-off/(recovery) rate
Average VaR ($mm)
1 See note 1 on slide 10
2 See note 3 on slide 11
For additional footnotes see slide 12.
1Q23
$13,600
1,560
2,396
267
JPMORGAN CHASE & CO.
4,223
5,699
2,683
1,148
(153)
9,377
7,483
58
$4,421
1Q23
$108.0
16%
55
30
$1,654
228.1
633.7
558.8
29.7
1.81%
0.11
$45
$ 0/(U)
4Q22
$3,002
171
276
(56)
391
1,960
752
(11)
(90)
2,611
988
(83)
$1,107
4Q22
$103.0
12%
61
29
$1,467
225.8
649.7
583.2
28.6
1.67%
0.02
$60
1Q22
$24
(497)
495
(54)
(56)
1
(372)
80
371
80
120
(387)
$49
1Q22
$103.0
16%
54
30
$2,050
212.4
709.1
490.2
31.6
1.31%
0.05
$64
CCB
CIB
CB
AWM Corp.
FINANCIAL PERFORMANCE
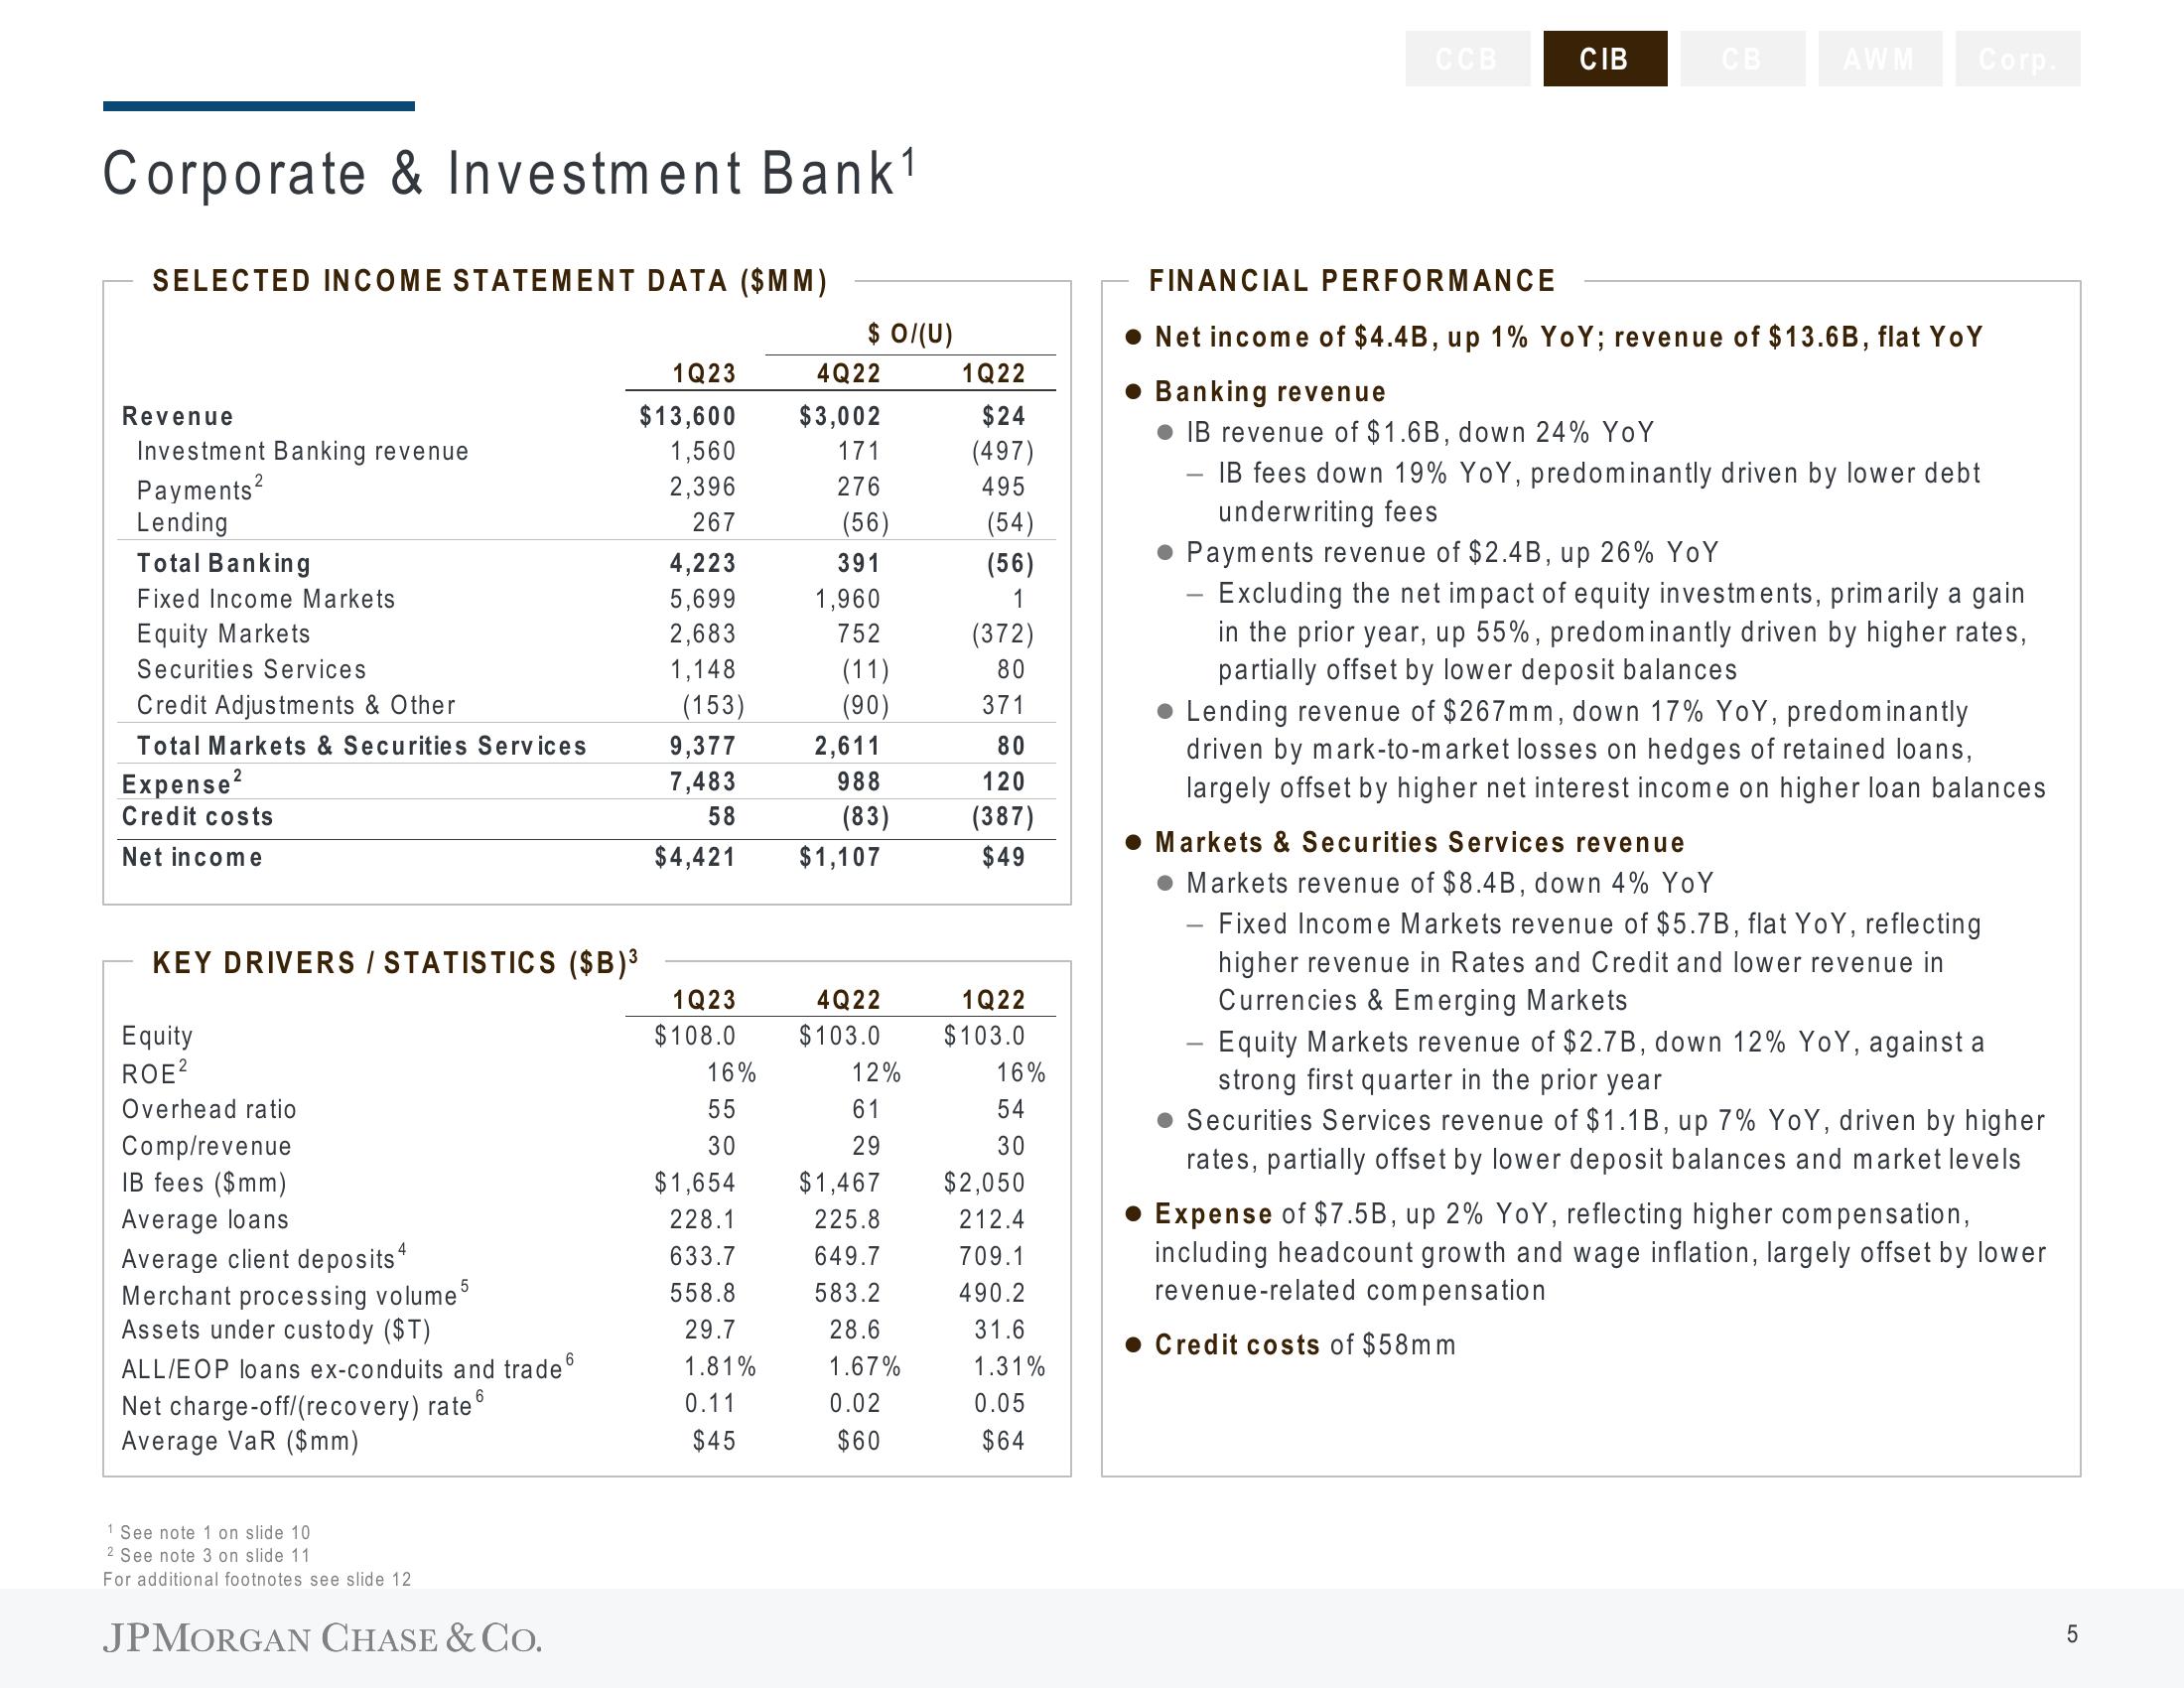
• Net income of $4.4B, up 1% YoY; revenue of $13.6B, flat YoY
• Banking revenue
-
IB revenue of $1.6B, down 24% YoY
IB fees down 19% YoY, predominantly driven by lower debt
underwriting fees
● Payments revenue of $2.4B, up 26% YoY
Excluding the net impact of equity investments, primarily a gain
in the prior year, up 55%, predominantly driven by higher rates,
partially offset by lower deposit balances
• Lending revenue of $267mm, down 17% YoY, predominantly
driven by mark-to-market losses on hedges of retained loans,
largely offset by higher net interest income on higher loan balances
Markets & Securities Services revenue
• Markets revenue of $8.4B, down 4% YoY
Fixed Income Markets revenue of $5.7B, flat YoY, reflecting
higher revenue in Rates and Credit and lower revenue in
Currencies & Emerging Markets
-
- Equity Markets revenue of $2.7B, down 12% YoY, against a
strong first quarter in the prior year
• Securities Services revenue of $1.1B, up 7% YoY, driven by higher
rates, partially offset by lower deposit balances and market levels
• Expense of $7.5B, up 2% YoY, reflecting higher compensation,
including headcount growth and wage inflation, largely offset by lower
revenue-related compensation
● Credit costs of $58mm
LO
5View entire presentation