Paysafe Results Presentation Deck
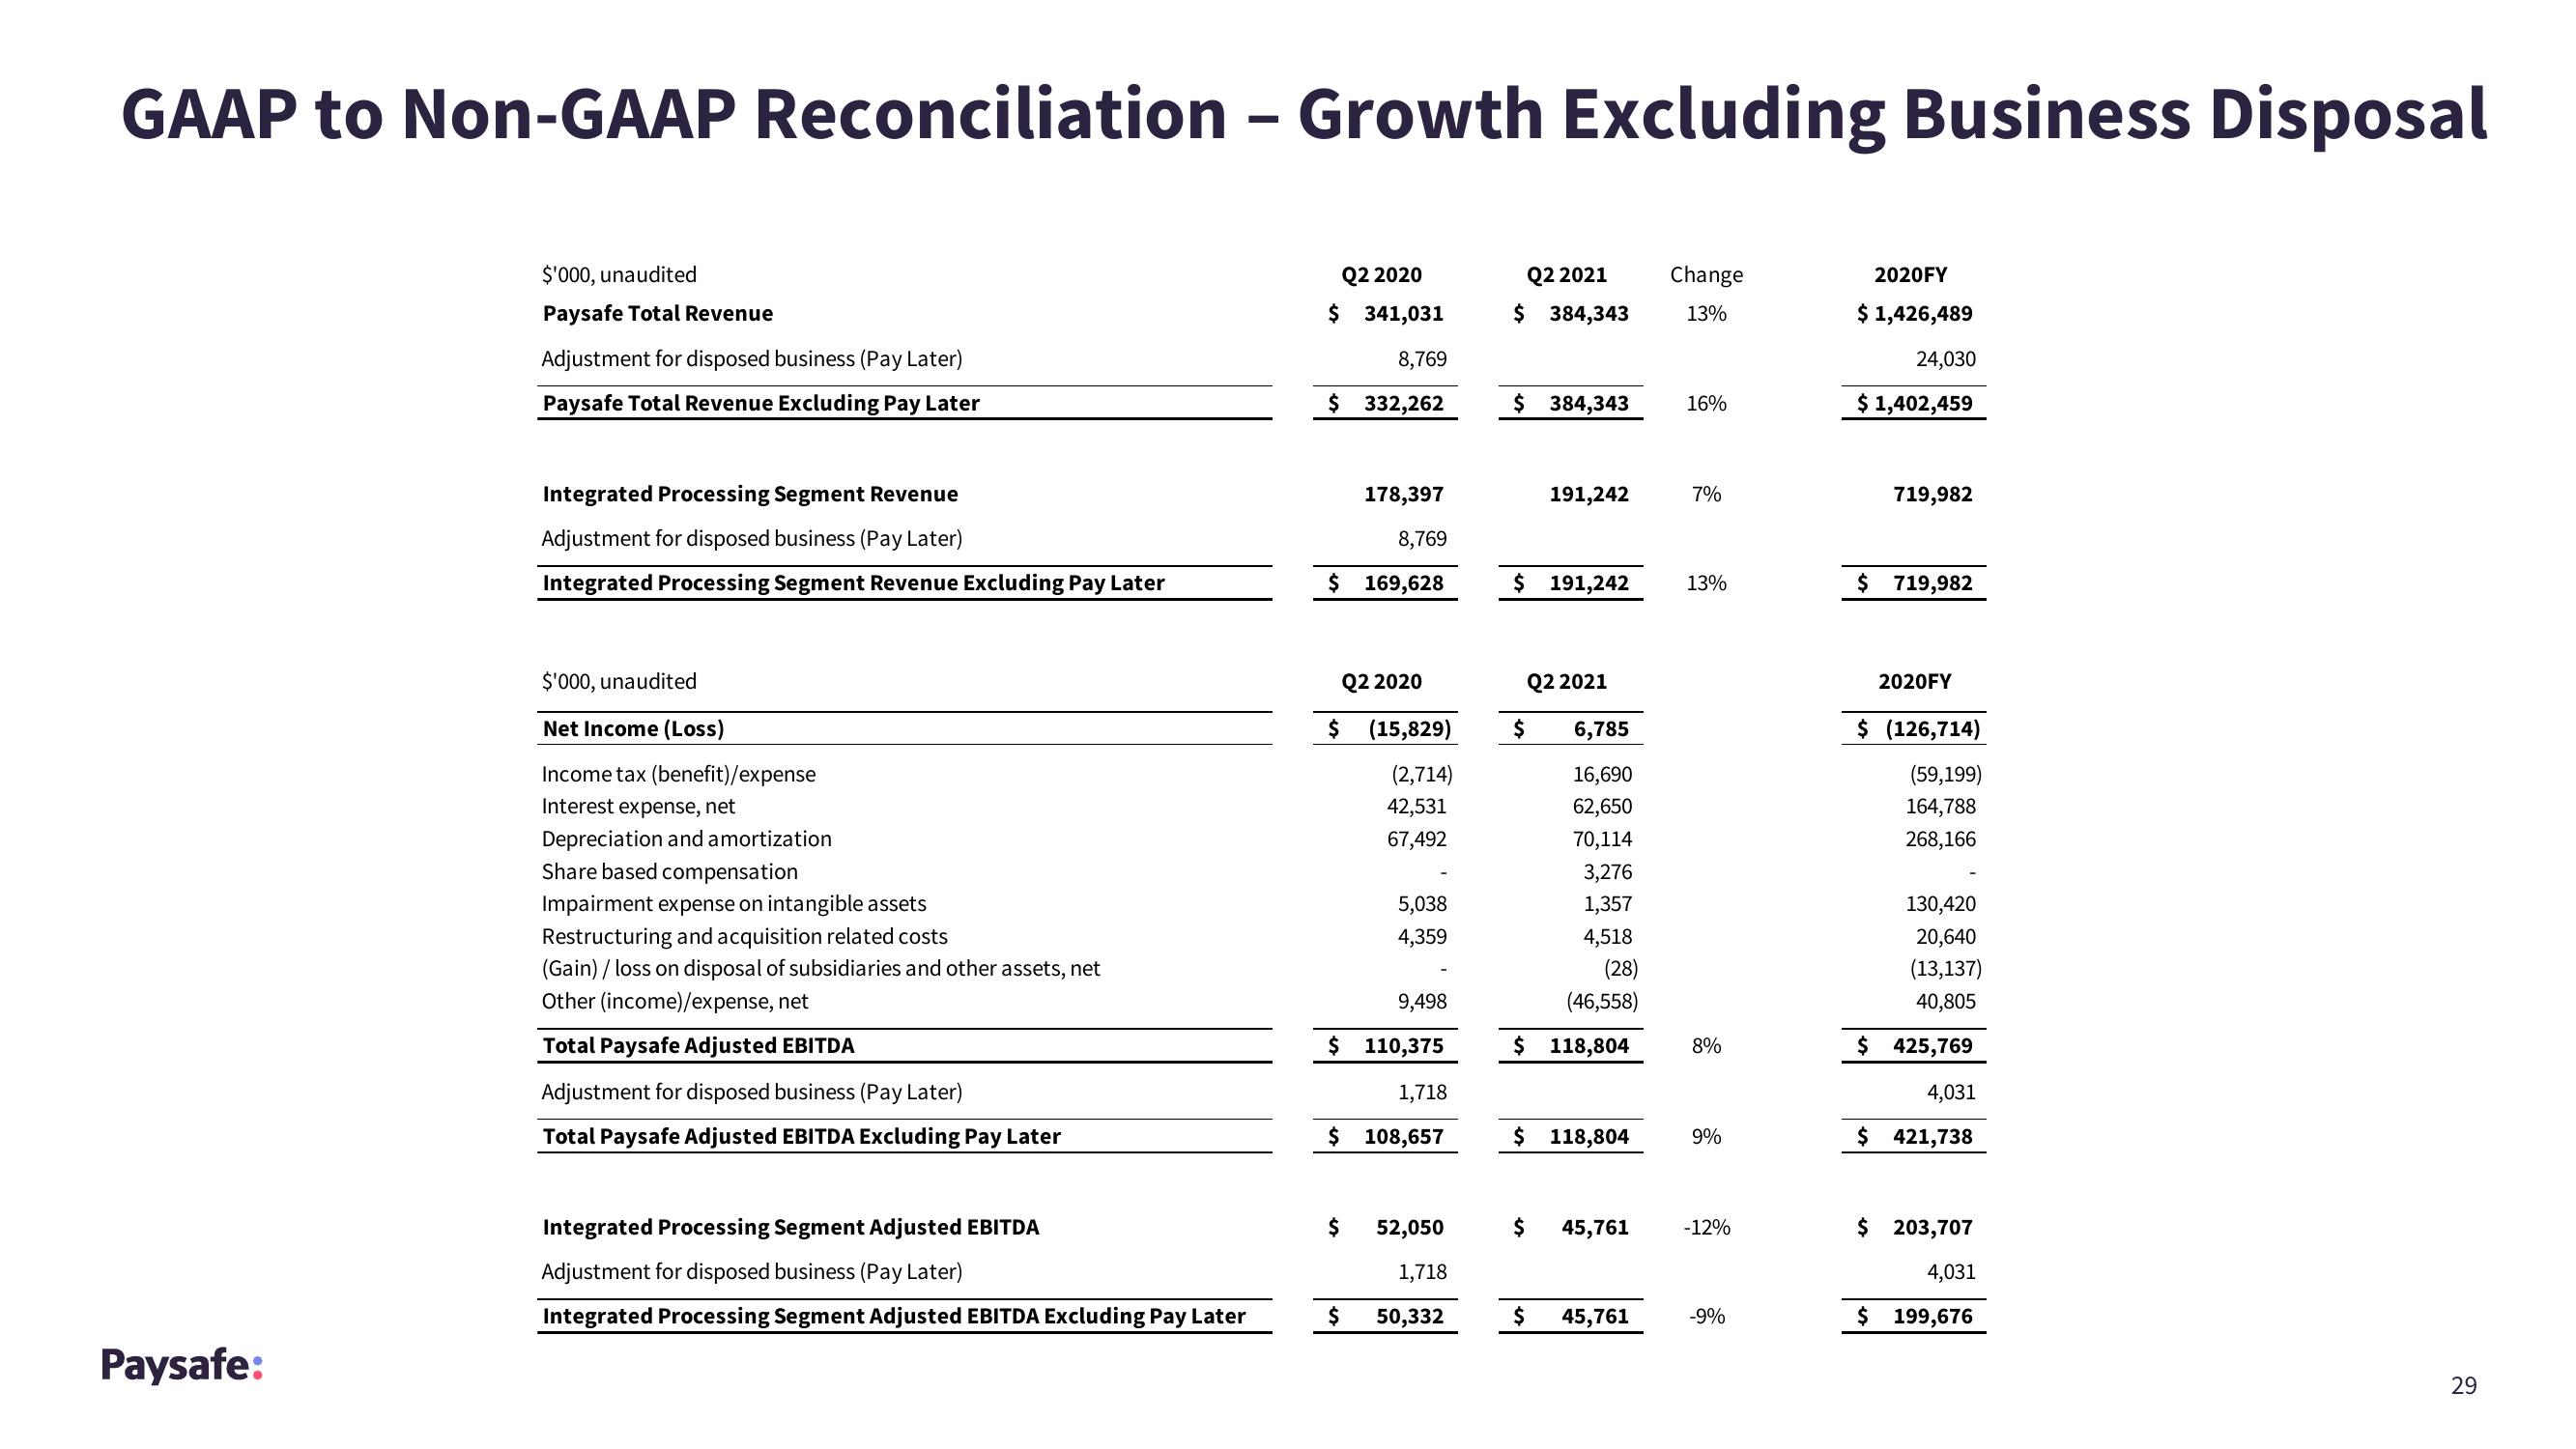
GAAP to Non-GAAP Reconciliation - Growth Excluding Business Disposal
Paysafe:
$'000, unaudited
Paysafe Total Revenue
Adjustment for disposed business (Pay Later)
Paysafe Total Revenue Excluding Pay Later
Integrated Processing Segment Revenue
Adjustment for disposed business (Pay Later)
Integrated Processing Segment Revenue Excluding Pay Later
$'000, unaudited
Net Income (Loss)
Income tax (benefit)/expense
Interest expense, net
Depreciation and amortization
Share based compensation
Impairment expense on intangible assets
Restructuring and acquisition related costs
(Gain) / loss on disposal of subsidiaries and other assets, net
Other (income)/expense, net
Total Paysafe Adjusted EBITDA
Adjustment for disposed business (Pay Later)
Total Paysafe Adjusted EBITDA Excluding Pay Later
Integrated Processing Segment Adjusted EBITDA
Adjustment for disposed business (Pay Later)
Integrated Processing Segment Adjusted EBITDA Excluding Pay Later
Q2 2020
$ 341,031
8,769
$ 332,262
178,397
8,769
$ 169,628
Q2 2020
$ (15,829)
(2,714)
42,531
67,492
9,498
$ 110,375
1,718
$ 108,657
$
5,038
4,359
$
52,050
1,718
50,332
Q2 2021
$ 384,343
$ 384,343
191,242
$ 191,242
Q2 2021
$ 6,785
16,690
62,650
70,114
3,276
1,357
4,518
(28)
(46,558)
$ 118,804
$ 118,804
$ 45,761
$
45,761
Change
13%
16%
7%
13%
8%
9%
-12%
-9%
2020FY
$ 1,426,489
24,030
$ 1,402,459
719,982
$ 719,982
2020FY
$ (126,714)
(59,199)
164,788
268,166
130,420
20,640
(13,137)
40,805
$ 425,769
4,031
$ 421,738
$ 203,707
4,031
$ 199,676
29View entire presentation