Servicing Portfolio Growth Deck
10 |
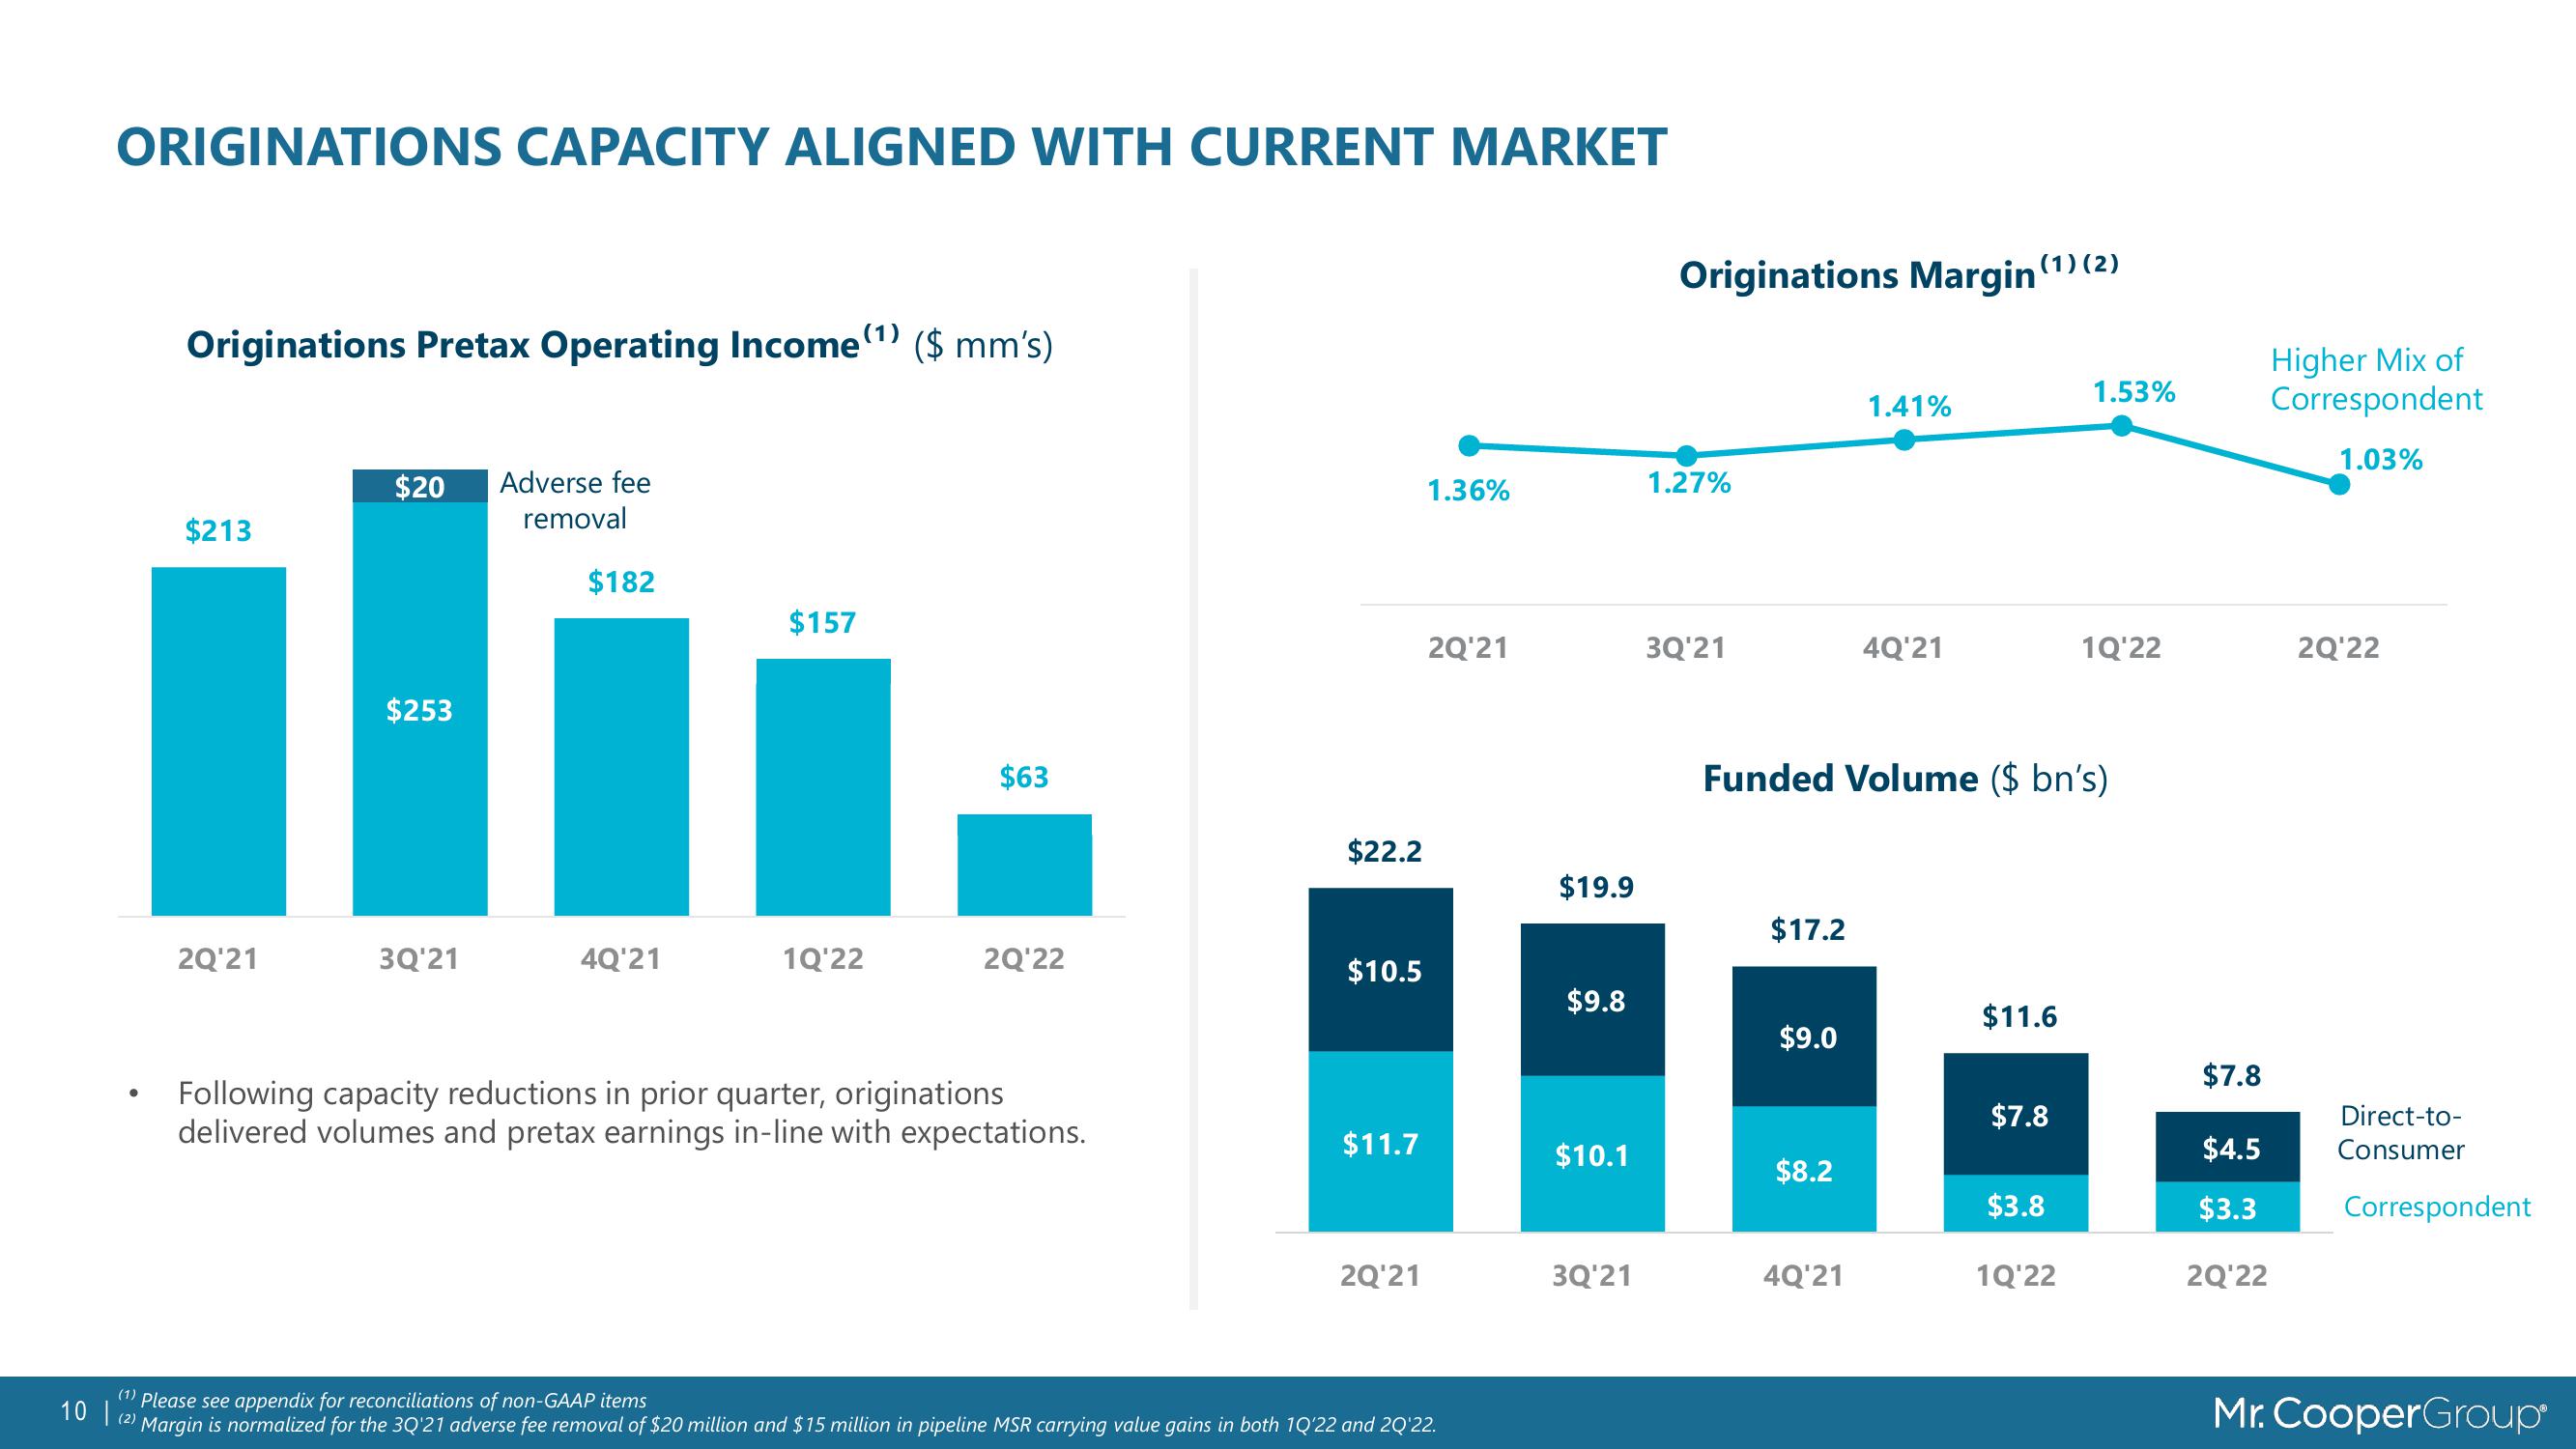
ORIGINATIONS CAPACITY ALIGNED WITH CURRENT MARKET
Originations Pretax Operating Income (¹) ($ mm's)
$213
2Q¹21
$20 Adverse fee
removal
$253
3Q'21
$182
4Q'21
$157
1Q'22
$63
2Q'22
Following capacity reductions in prior quarter, originations
delivered volumes and pretax earnings in-line with expectations.
$22.2
$10.5
$11.7
2Q¹21
1.36%
2Q'21
(1) Please see appendix for reconciliations of non-GAAP items
(2)
Margin is normalized for the 3Q'21 adverse fee removal of $20 million and $15 million in pipeline MSR carrying value gains in both 10'22 and 2Q'22.
$19.9
$9.8
$10.1
3Q'21
Originations Margin (1) (2)
1.27%
3Q'21
$17.2
$9.0
$8.2
1.41%
Funded Volume ($ bn's)
4Q'21
4Q'21
$11.6
$7.8
1.53%
$3.8
1Q'22
1Q'22
$7.8
$4.5
$3.3
2Q'22
Higher Mix of
Correspondent
1.03%
2Q'22
Direct-to-
Consumer
Correspondent
Mr. CooperGroupView entire presentation