Pearson Investor Presentation Deck
Higher Education
Growth drivers
Implementing product-led
operating model, and
leveraging positive
momentum for Pearson+
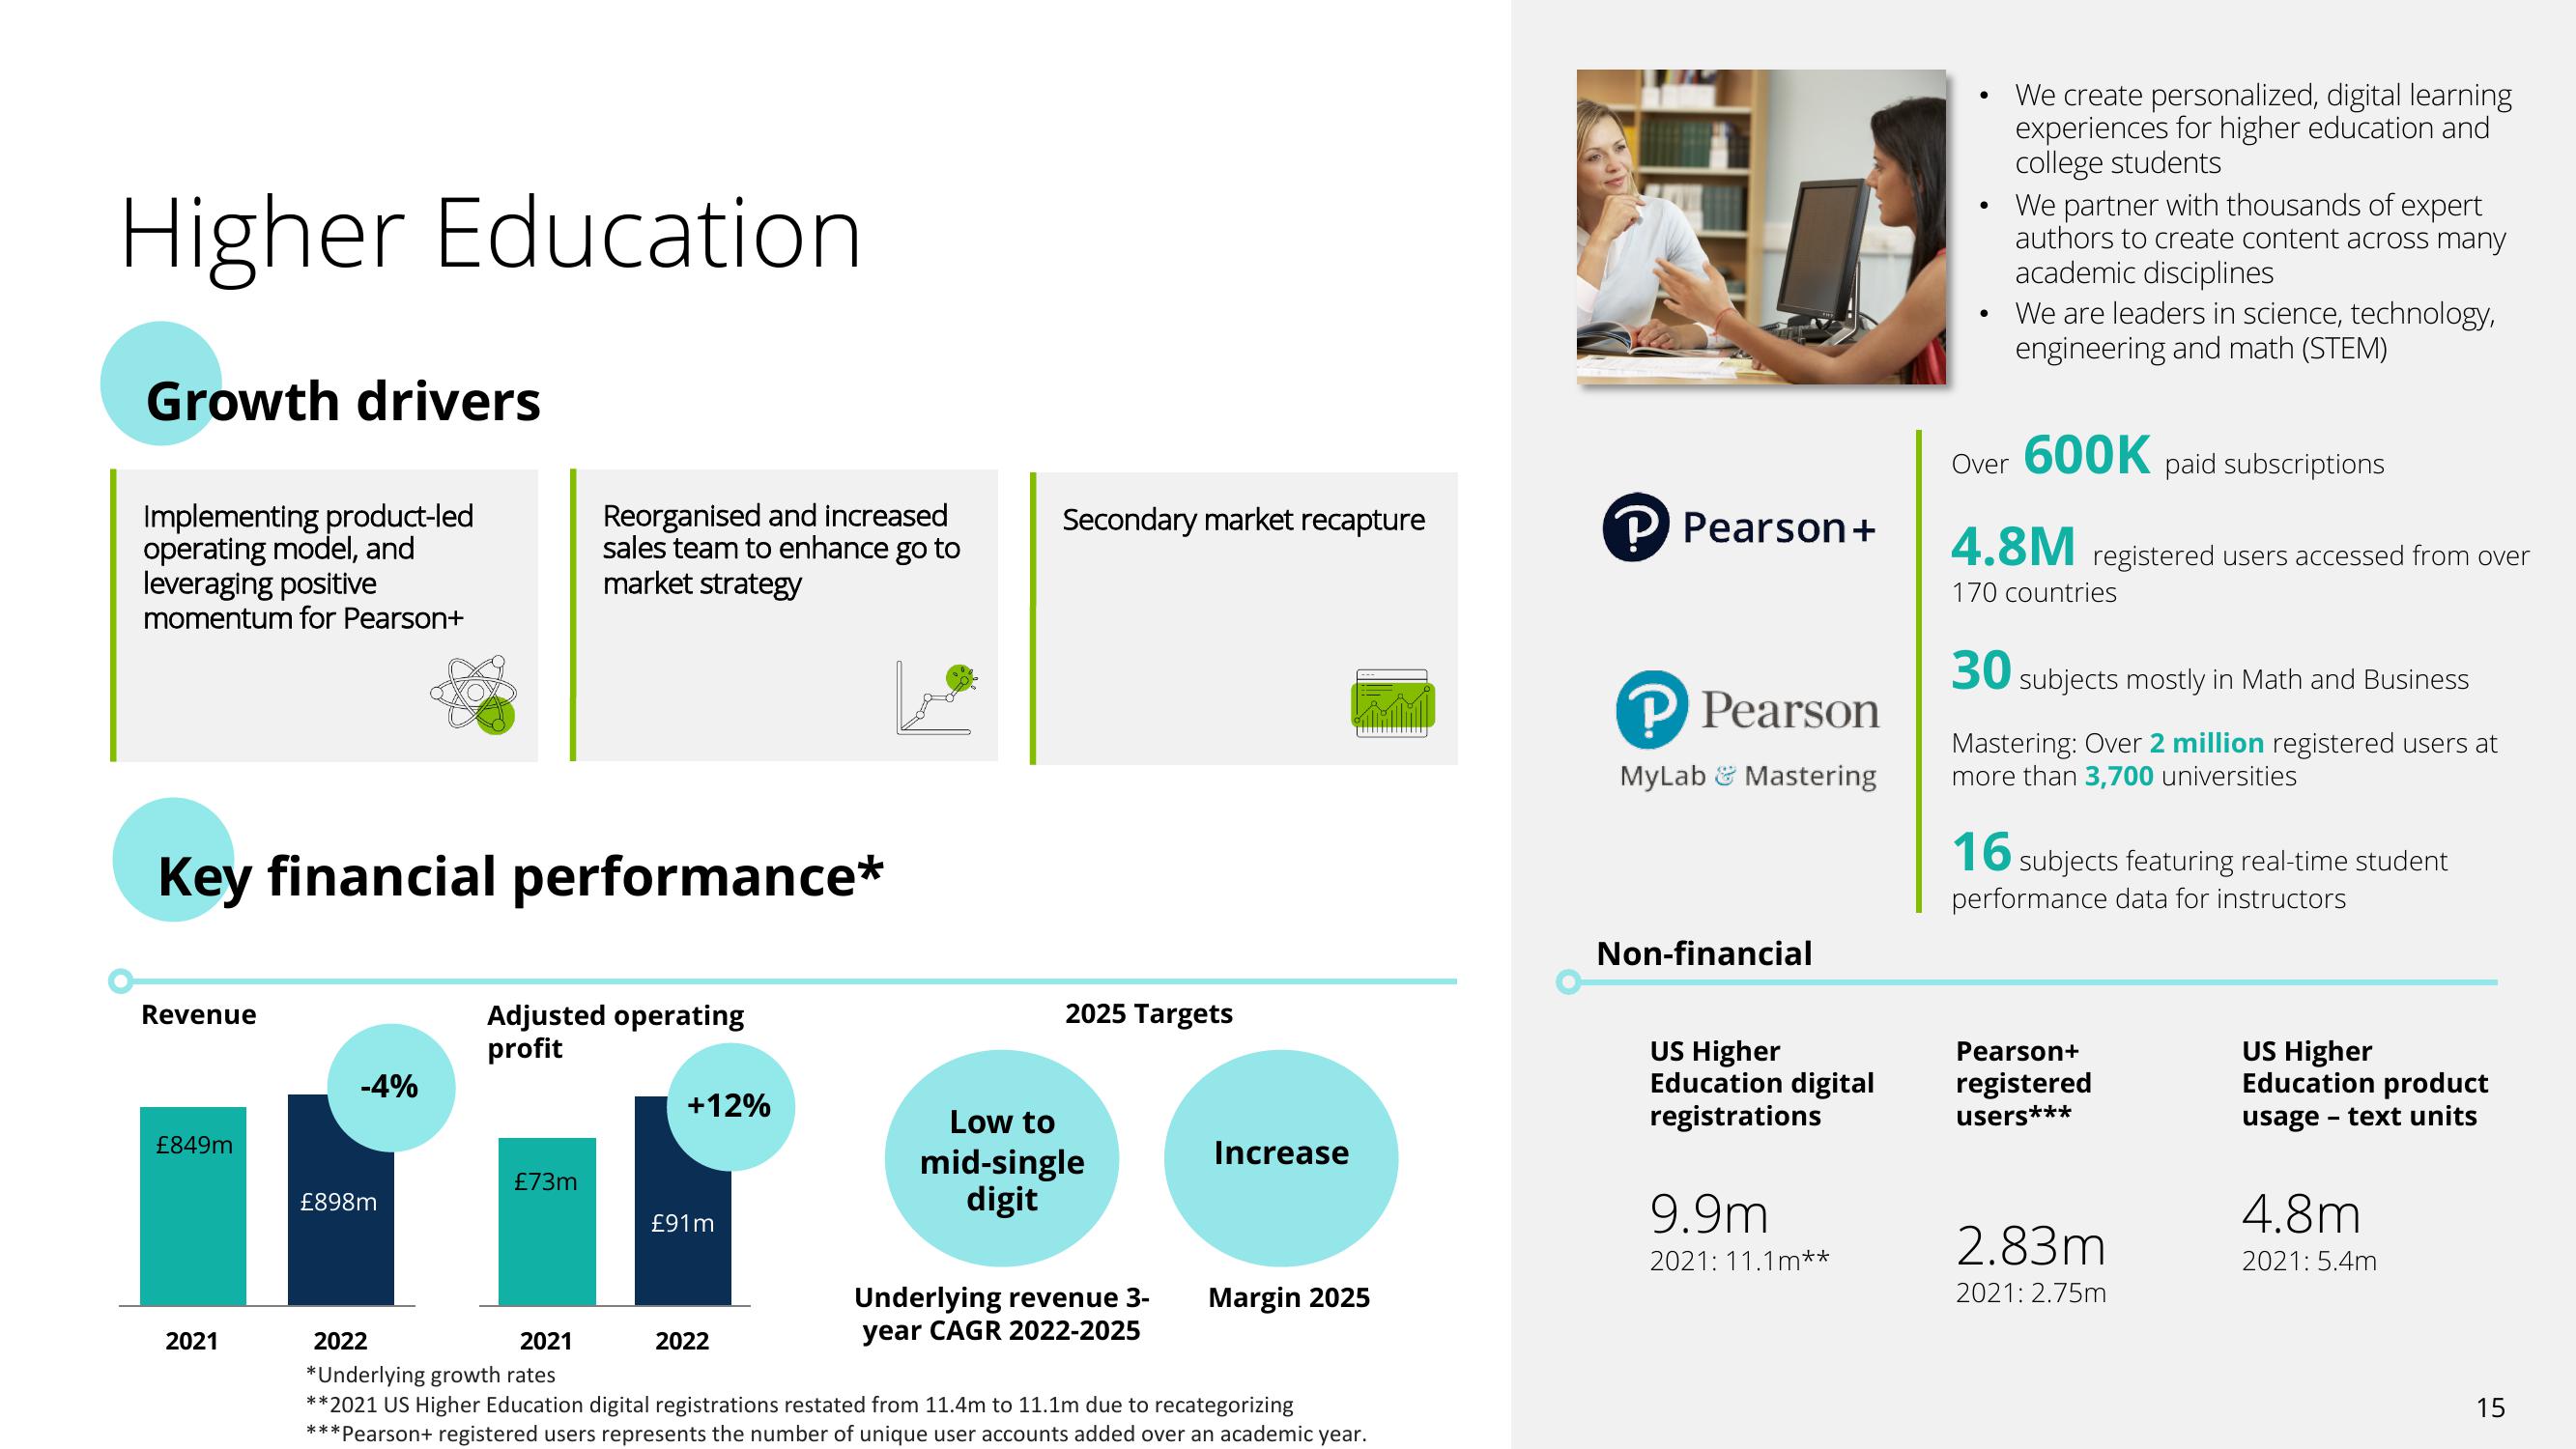
Key financial performance*
Revenue
£849m
2021
-4%
£898m
Reorganised and increased
sales team to enhance go to
market strategy
Adjusted operating
profit
£73m
+12%
£91m
2022
Secondary market recapture
2025 Targets
Low to
mid-single
digit
Underlying revenue 3-
year CAGR 2022-2025
Increase
Margin 2025
2022
2021
*Underlying growth rates
**2021 US Higher Education digital registrations restated from 11.4m to 11.1m due to recategorizing
***Pearson+ registered users represents the number of unique user accounts added over an academic year.
M
P Pearson +
P Pearson
MyLab & Mastering
Non-financial
US Higher
Education digital
registrations
9.9m
2021: 11.1m**
●
We create personalized, digital learning
experiences for higher education and
college students
We partner with thousands of expert
authors to create content across many
academic disciplines
We are leaders in science, technology,
engineering and math (STEM)
Over 600K paid subscriptions
4.8M registered users accessed from over
170 countries
30 subjects mostly in Math and Business
Mastering: Over 2 million registered users at
more than 3,700 universities
16 subjects featuring real-time student
performance data for instructors
Pearson+
registered
users***
2.83m
2021: 2.75m
US Higher
Education product
usage - text units
4.8m
2021: 5.4m
15View entire presentation