Evercore Investment Banking Pitch Book
Situation Analysis
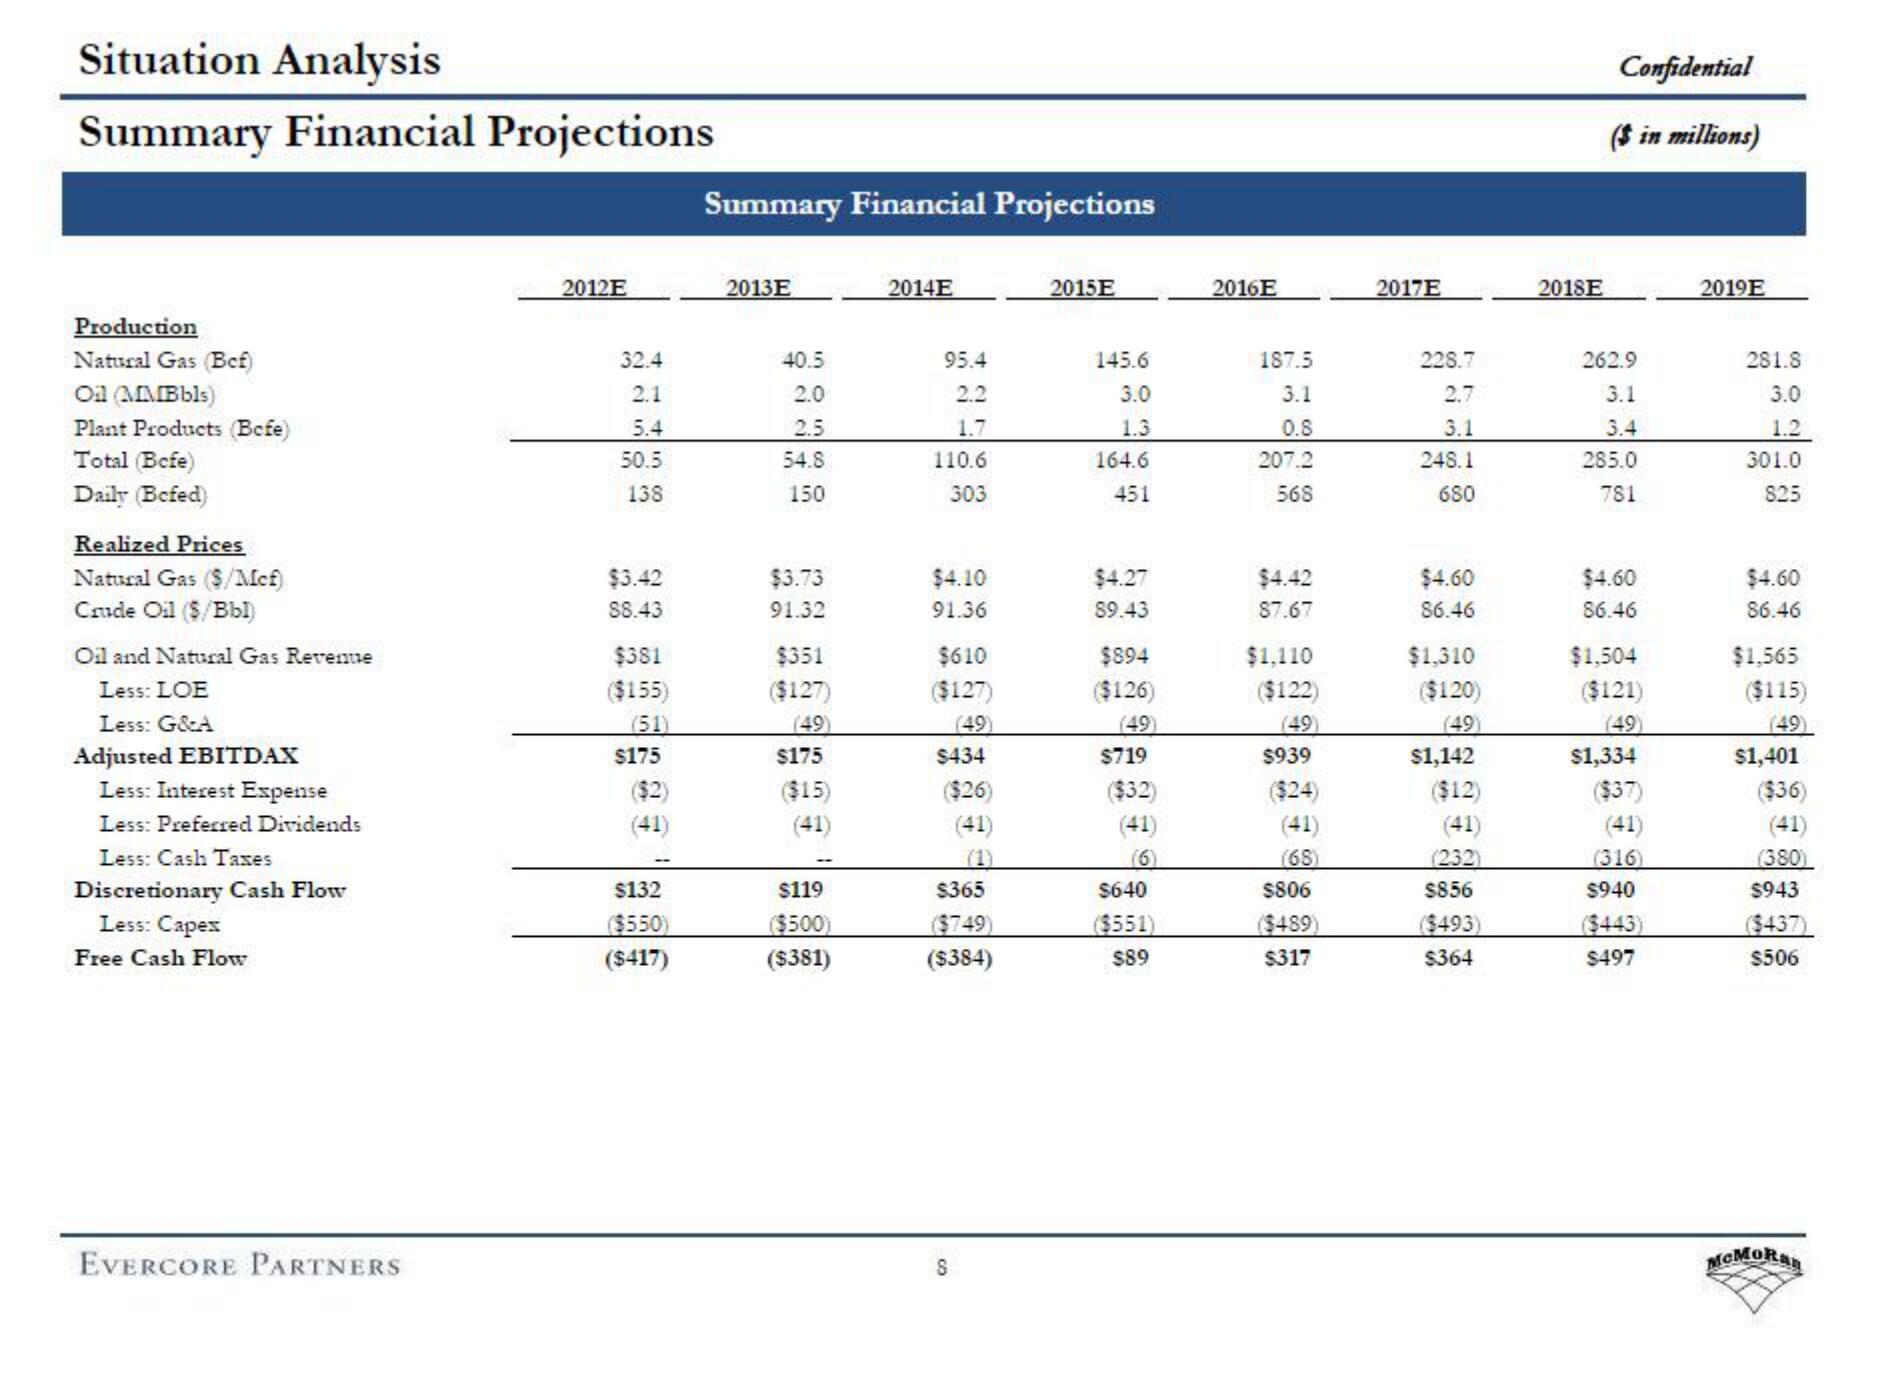
Summary Financial Projections
Production
Natural Gas (Bef)
Oil (MMBbls)
Plant Products (Befe)
Total Befe)
Daily (Befed)
Realized Prices
Natural Gas ($/Mcf)
Crude Oil ($/Bbl)
Oil and Natural Gas Revenue
Less: LOE
Less: G&A
Adjusted EBITDAX
Less: Interest Expense
Less: Preferred Dividends
Less: Cash Taxes
Discretionary Cash Flow
Less: Capex
Free Cash Flow
EVERCORE PARTNERS
2012E
32.4
2.1
5.4
50.5
138
$3.42
$8.43
$381
($155)
(51)
$175
(41)
$132
($550)
($417)
Summary Financial Projections
2013E
40.5
2.0
2.5
54.8
150
$3.73
91.32
$351
($127)
(49)
$175
($15)
$119
($500)
($381)
2014E
95.4
2.2
1.7
110.6
303
$4.10
91.36
$610
($127)
$434
($26)
(41)
$365
($749)
($384)
8
2015E
145.6
3.0
1.3
164.6
451
$4.27
89.43
$894
($126)
(49)
$719
($32)
(41)
$640
($551)
$89
2016E
187.5
3.1
0.8
207.2
568
$4.42
87.67
$1,110
($122)
$939
(41)
(68)
$806
($489)
$317
2017E
228.7
2.7
3.1
248.1
680
$4.60
86.46
$1.310
($120)
(49)
$1,142
($12)
(41)
(232)
$856
($493)
$364
2018E
Confidential
($ in millions)
262.9
3.1
3.4
285.0
781
$4.60
86.46
$1.504
($121)
(49)
$1,334
($37)
(41)
(316)
$940
($443)
$497
2019E
281.8
3.0
1.2
301.0
825
$4.60
86.46
$1,565
($115)
(49)
$1,401
($36)
(41)
(380)
$943
($437)
$506
McMoRanView entire presentation