Fastly Investor Presentation Deck
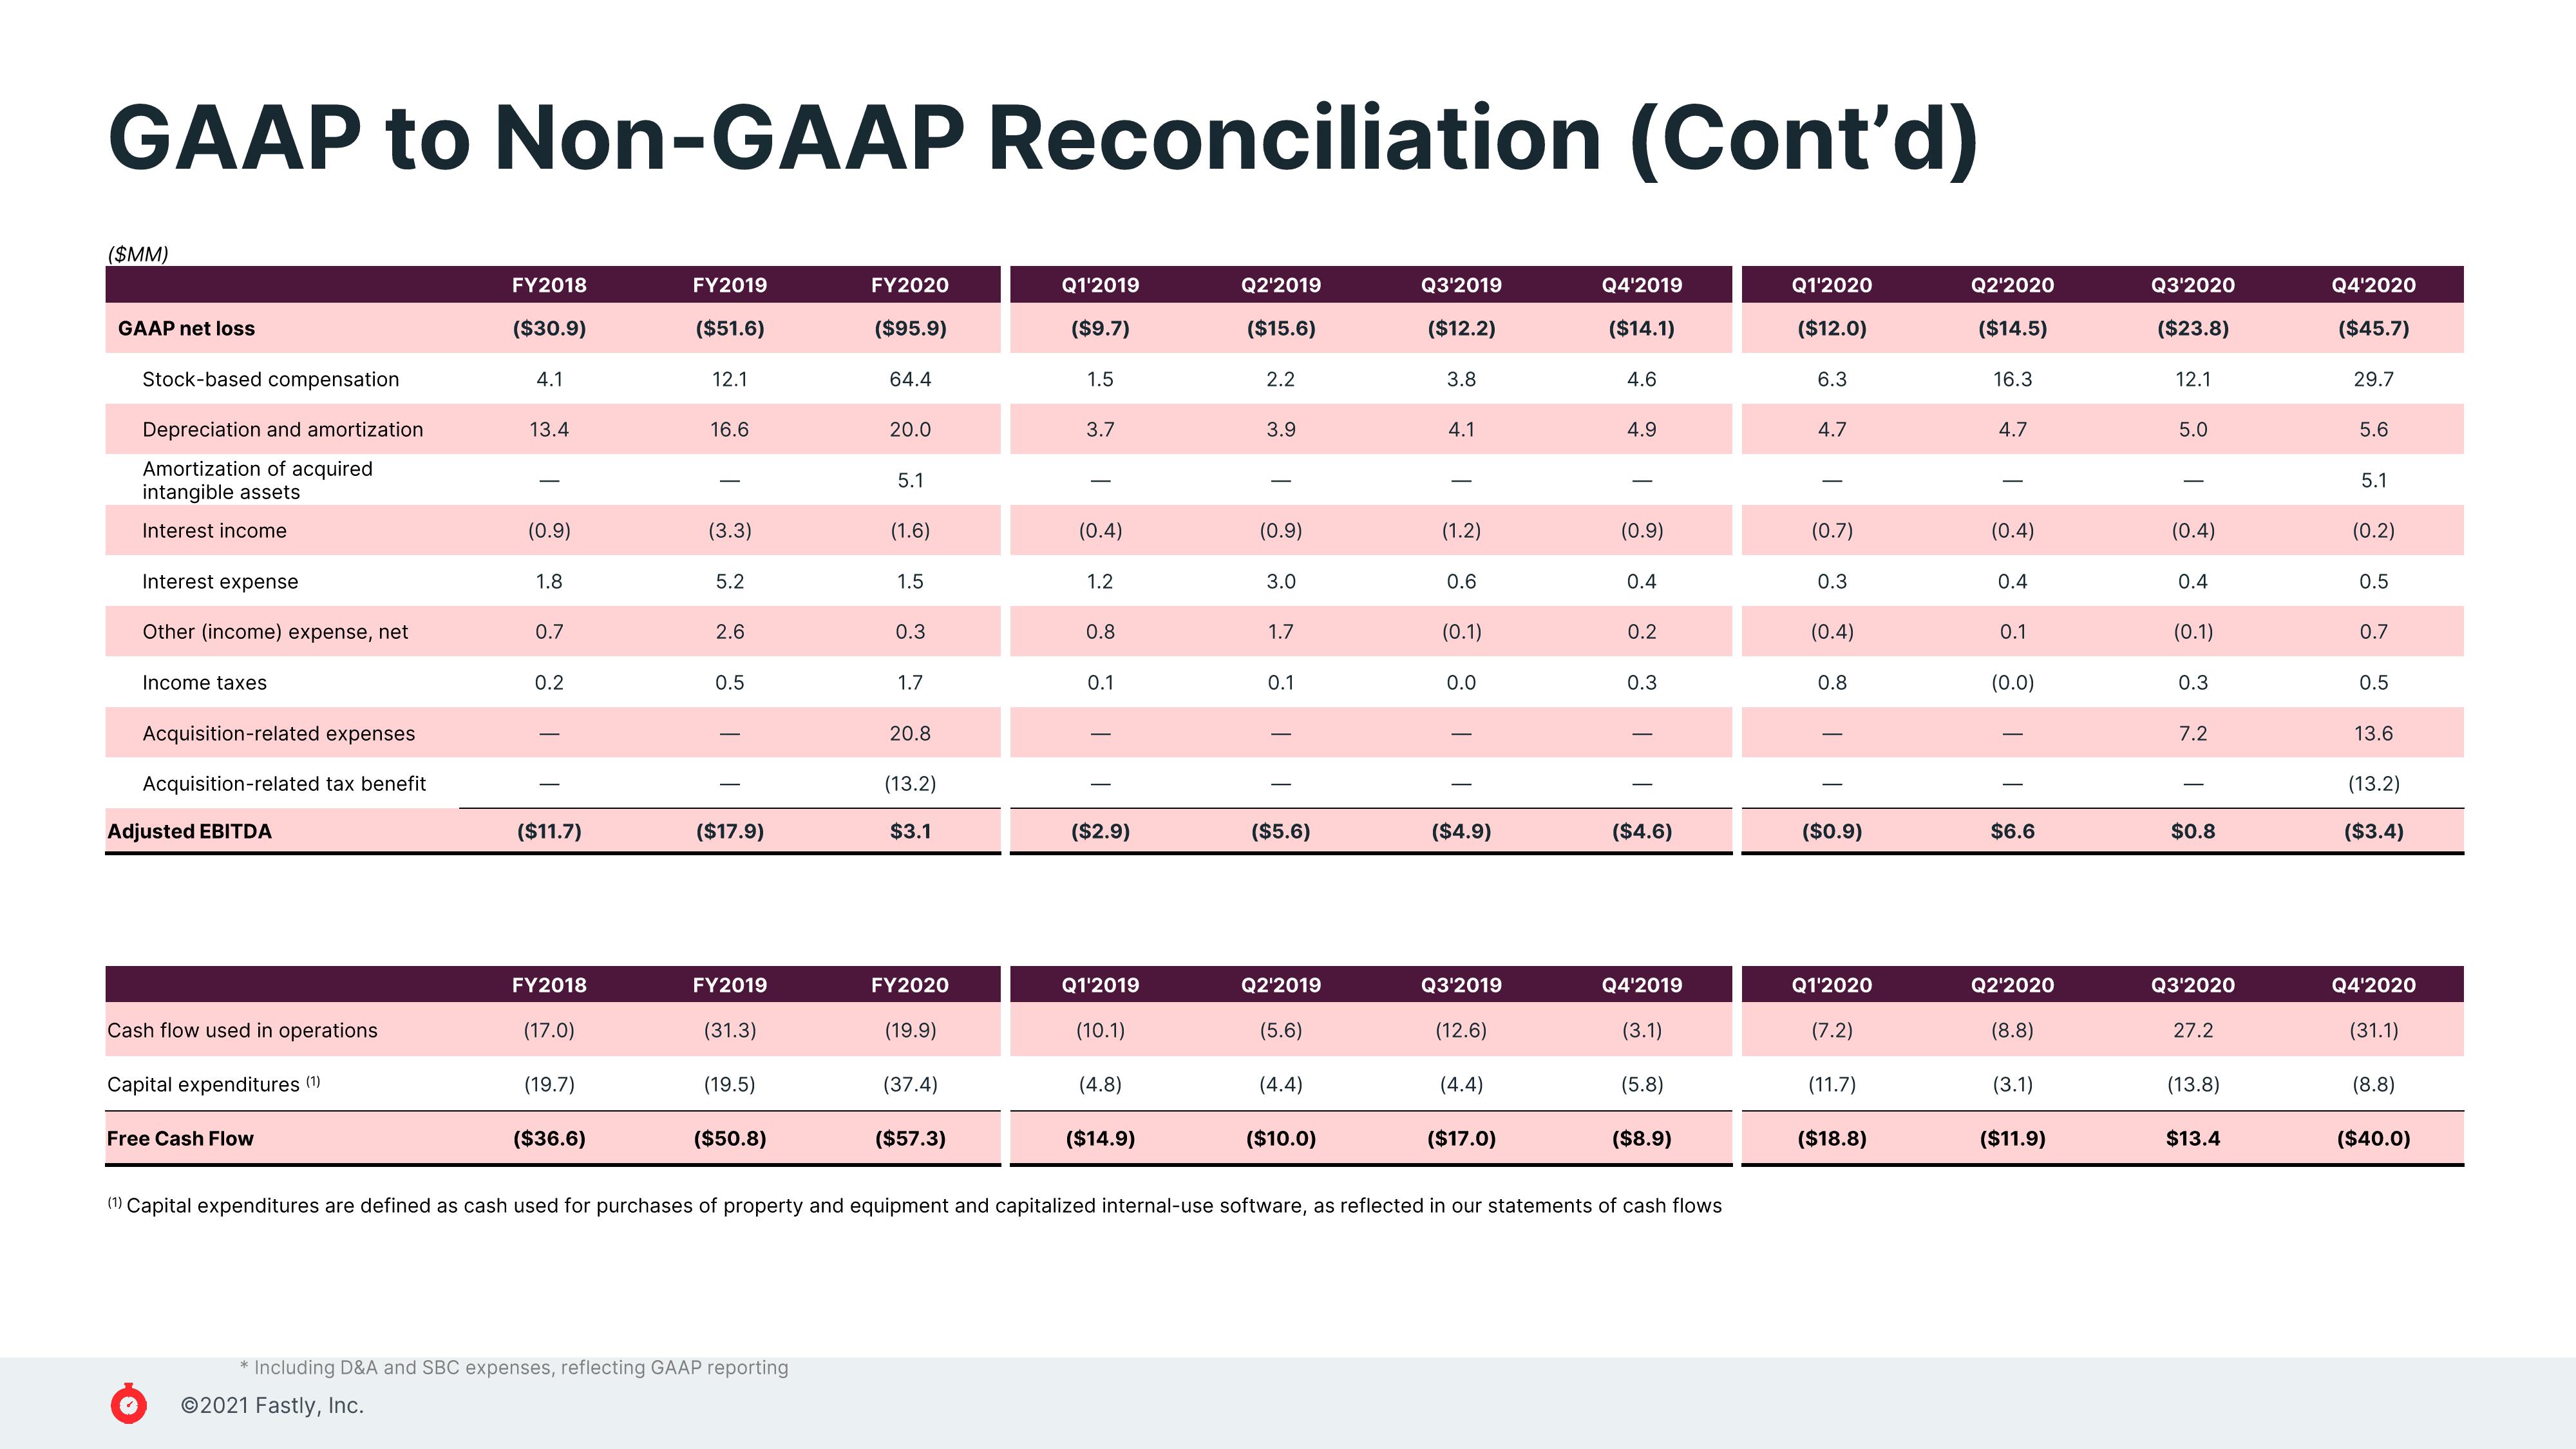
GAAP to Non-GAAP Reconciliation (Cont'd)
FY2019
($51.6)
Q2¹2019
($15.6)
($MM)
GAAP net loss
Stock-based compensation
Depreciation and amortization
Amortization of acquired
intangible assets
Interest income
Interest expense
Other (income) expense, net
Income taxes
Acquisition-related expenses
Acquisition-related tax benefit
Adjusted EBITDA
Cash flow used in operations
Capital expenditures (¹)
Free Cash Flow
FY2018
($30.9)
4.1
Ⓒ2021 Fastly, Inc.
13.4
(0.9)
1.8
0.7
0.2
($11.7)
FY2018
(17.0)
(19.7)
($36.6)
12.1
16.6
(3.3)
5.2
2.6
0.5
($17.9)
FY2019
(31.3)
(19.5)
($50.8)
* Including D&A and SBC expenses, reflecting GAAP reporting
FY2020
($95.9)
64.4
20.0
5.1
(1.6)
1.5
0.3
1.7
20.8
(13.2)
$3.1
FY2020
(19.9)
(37.4)
($57.3)
Q1'2019
($9.7)
1.5
3.7
(0.4)
1.2
0.8
0.1
($2.9)
Q1'2019
(10.1)
(4.8)
($14.9)
2.2
3.9
(0.9)
3.0
1.7
0.1
($5.6)
Q2'2019
(5.6)
(4.4)
($10.0)
Q3'2019
($12.2)
3.8
4.1
(1.2)
0.6
(0.1)
0.0
($4.9)
Q3'2019
(12.6)
(4.4)
($17.0)
Q4¹2019
($14.1)
4.6
4.9
(0.9)
0.4
0.2
0.3
($4.6)
(1) Capital expenditures are defined as cash used for purchases of property and equipment and capitalized internal-use software, as reflected in our statements of cash flows
Q4'2019
(3.1)
(5.8)
($8.9)
Q1¹2020
($12.0)
6.3
4.7
(0.7)
0.3
(0.4)
0.8
($0.9)
Q1'2020
(7.2)
(11.7)
($18.8)
Q2¹2020
($14.5)
16.3
4.7
(0.4)
0.4
0.1
(0.0)
$6.6
Q2¹2020
(8.8)
(3.1)
($11.9)
Q3'2020
($23.8)
12.1
5.0
(0.4)
0.4
(0.1)
0.3
7.2
$0.8
Q3'2020
27.2
(13.8)
$13.4
Q4'2020
($45.7)
29.7
5.6
5.1
(0.2)
0.5
0.7
0.5
13.6
(13.2)
($3.4)
Q4'2020
(31.1)
(8.8)
($40.0)View entire presentation