Nexters Results Presentation Deck
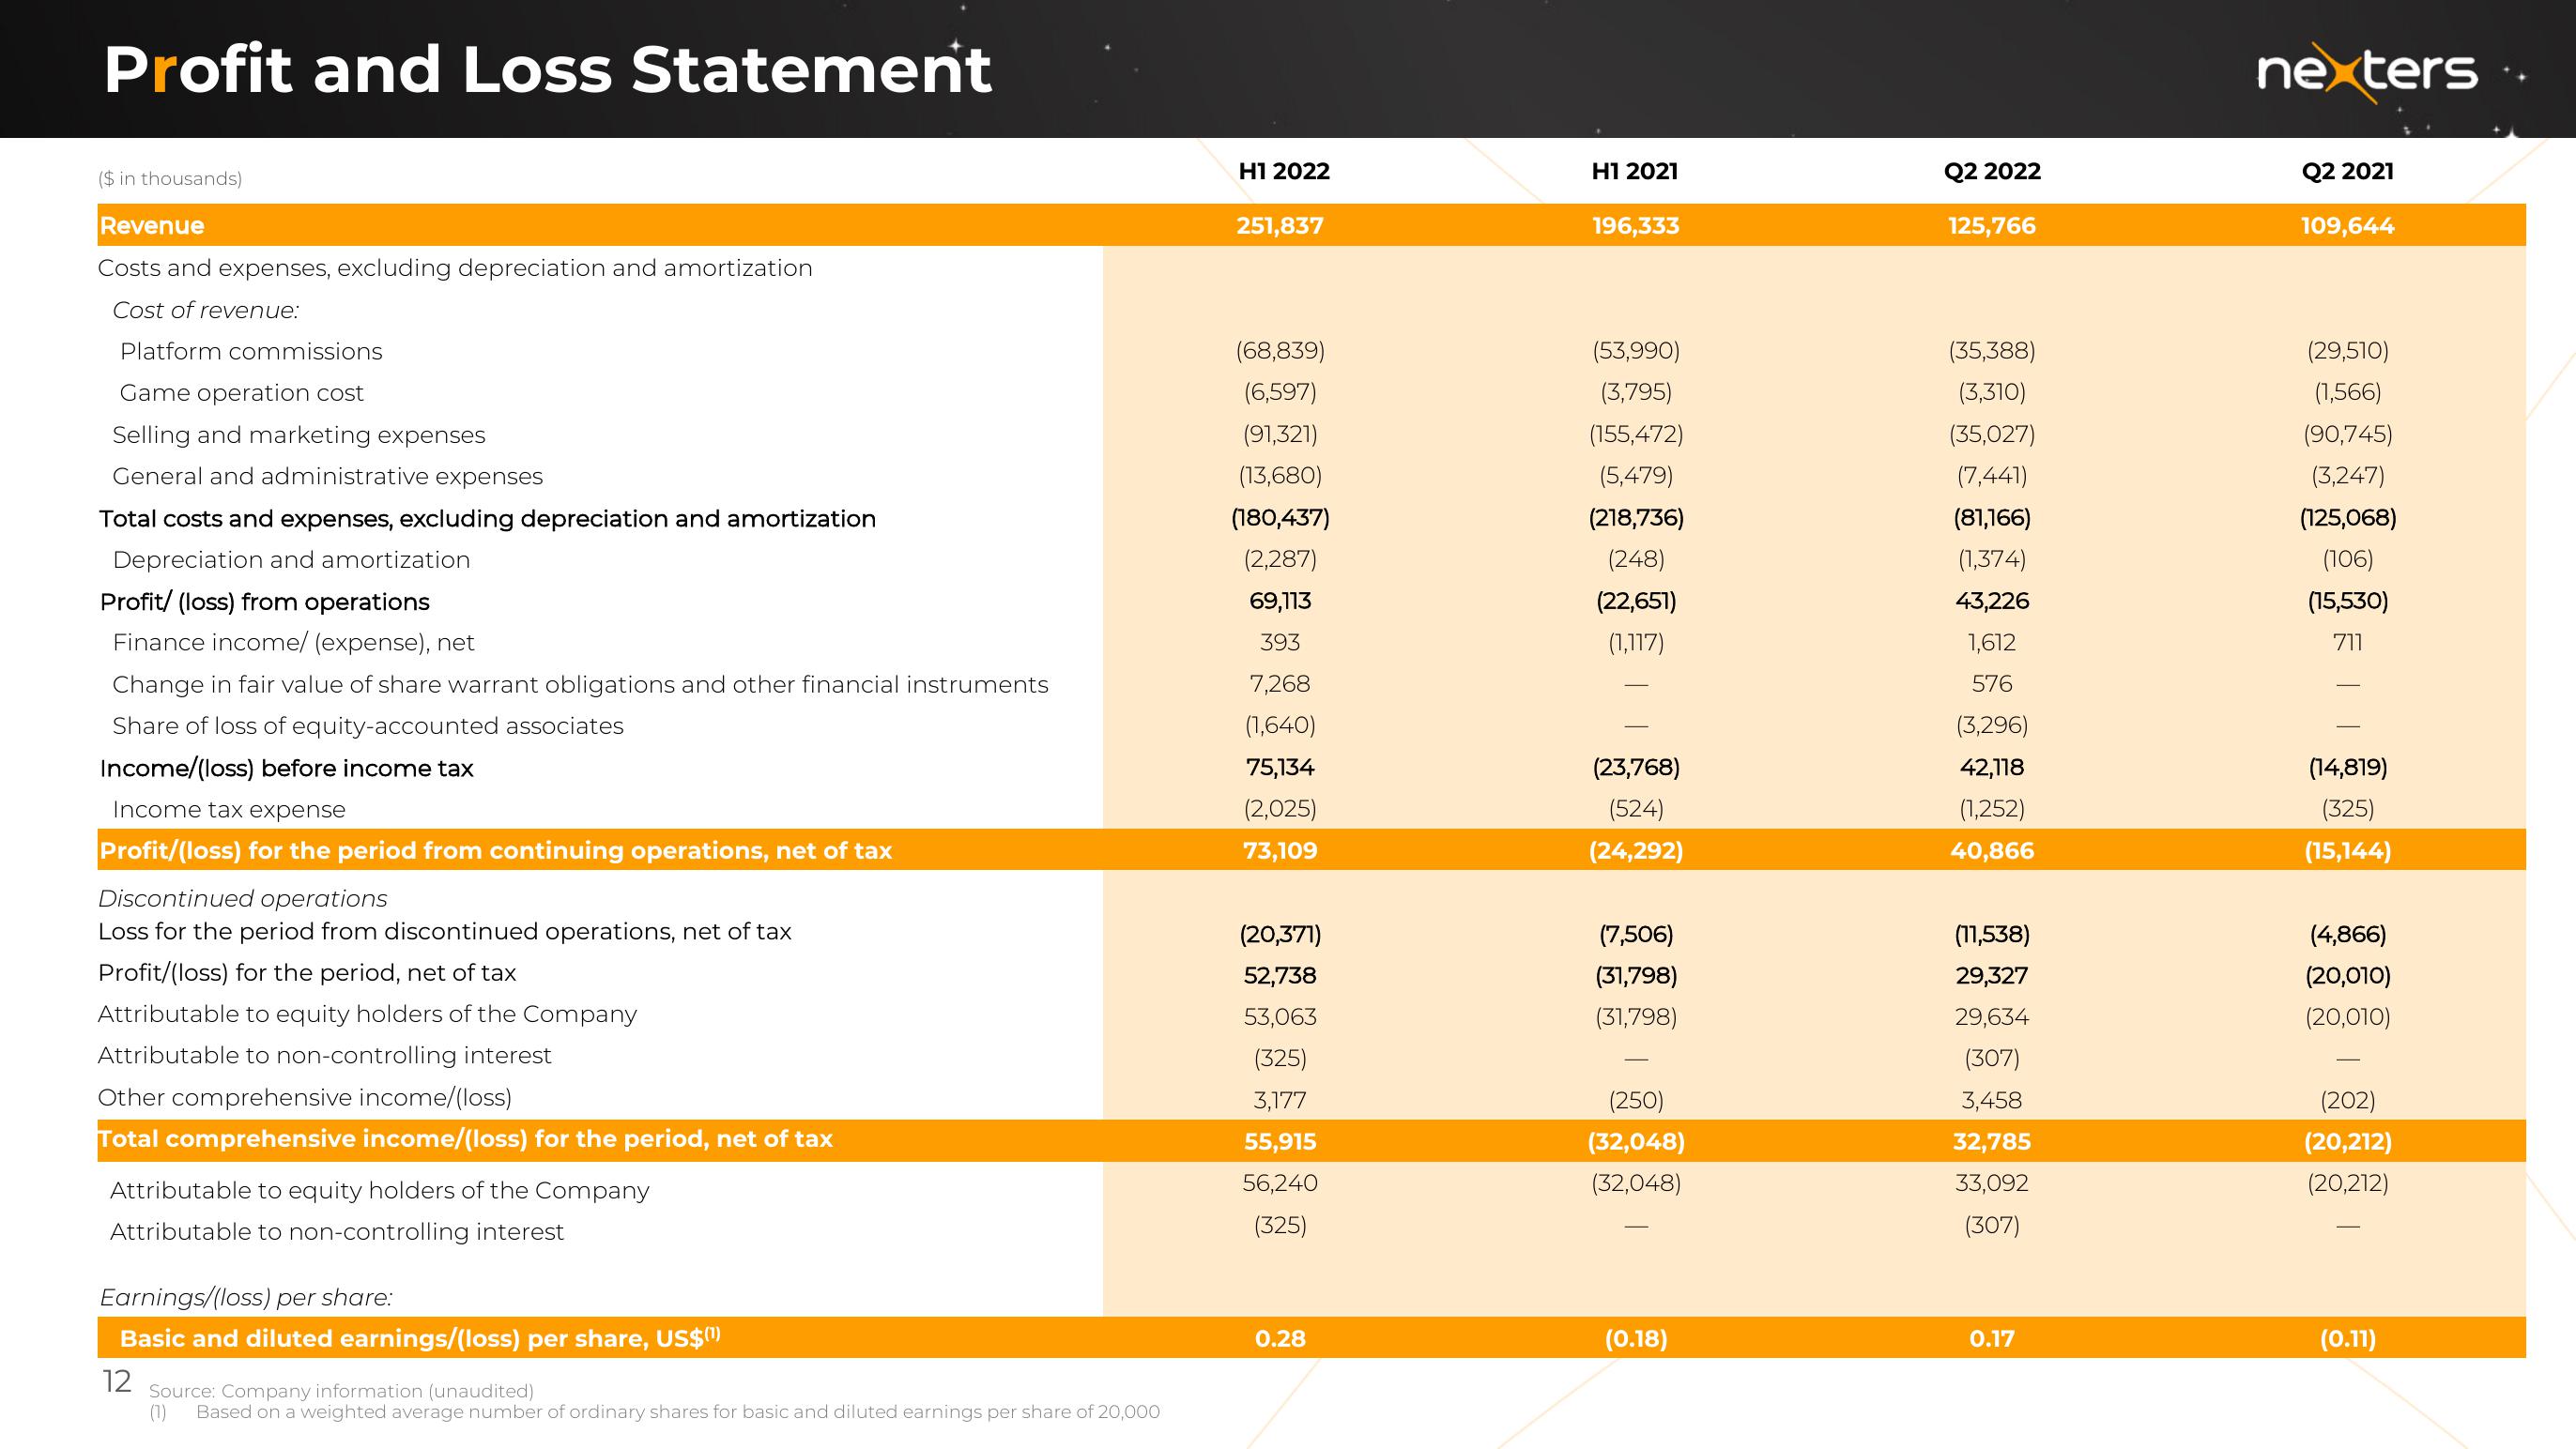
Profit and Loss Statement
($ in thousands)
Revenue
Costs and expenses, excluding depreciation and amortization
Cost of revenue:
Platform commissions
Game operation cost
Selling and marketing expenses
General and administrative expenses
Total costs and expenses, excluding depreciation and amortization
Depreciation and amortization
Profit/ (loss) from operations
Finance income/ (expense), net
Change in fair value of share warrant obligations and other financial instruments
Share of loss of equity-accounted associates
Income/(loss) before income tax
Income tax expense
Profit/(loss) for the period from continuing operations, net of tax
Discontinued operations
Loss for the period from discontinued operations, net of tax
Profit/(loss) for the period, net of tax
Attributable to equity holders of the Company
Attributable to non-controlling interest
Other comprehensive income/(loss)
Total comprehensive income/(loss) for the period, net of tax
Attributable to equity holders of the Company
Attributable to non-controlling interest
Earnings/(loss) per share:
Basic and diluted earnings/(loss) per share, US$(¹)
12
Source: Company information (unaudited)
(1) Based on a weighted average number of ordinary shares for basic and diluted earnings per share of 20,000
H1 2022
251,837
(68,839)
(6,597)
(91,321)
(13,680)
(180,437)
(2,287)
69,113
393
7,268
(1,640)
75,134
(2,025)
73,109
(20,371)
52,738
53,063
(325)
3,177
55,915
56,240
(325)
0.28
H1 2021
196,333
(53,990)
(3,795)
(155,472)
(5,479)
(218,736)
(248)
(22,651)
(1,117)
(23,768)
(524)
(24,292)
(7,506)
(31,798)
(31,798)
(250)
(32,048)
(32,048)
(0.18)
Q2 2022
125,766
(35,388)
(3,310)
(35,027)
(7,441)
(81,166)
(1,374)
43,226
1,612
576
(3,296)
42,118
(1,252)
40,866
(11,538)
29,327
29,634
(307)
3,458
32,785
33,092
(307)
0.17
nexters
Q2 2021
109,644
(29,510)
(1,566)
(90,745)
(3,247)
(125,068)
(106)
(15,530)
711
(14,819)
(325)
(15,144)
(4,866)
(20,010)
(20,010)
(202)
(20,212)
(20,212)
(0.11)View entire presentation