Allwyn Results Presentation Deck
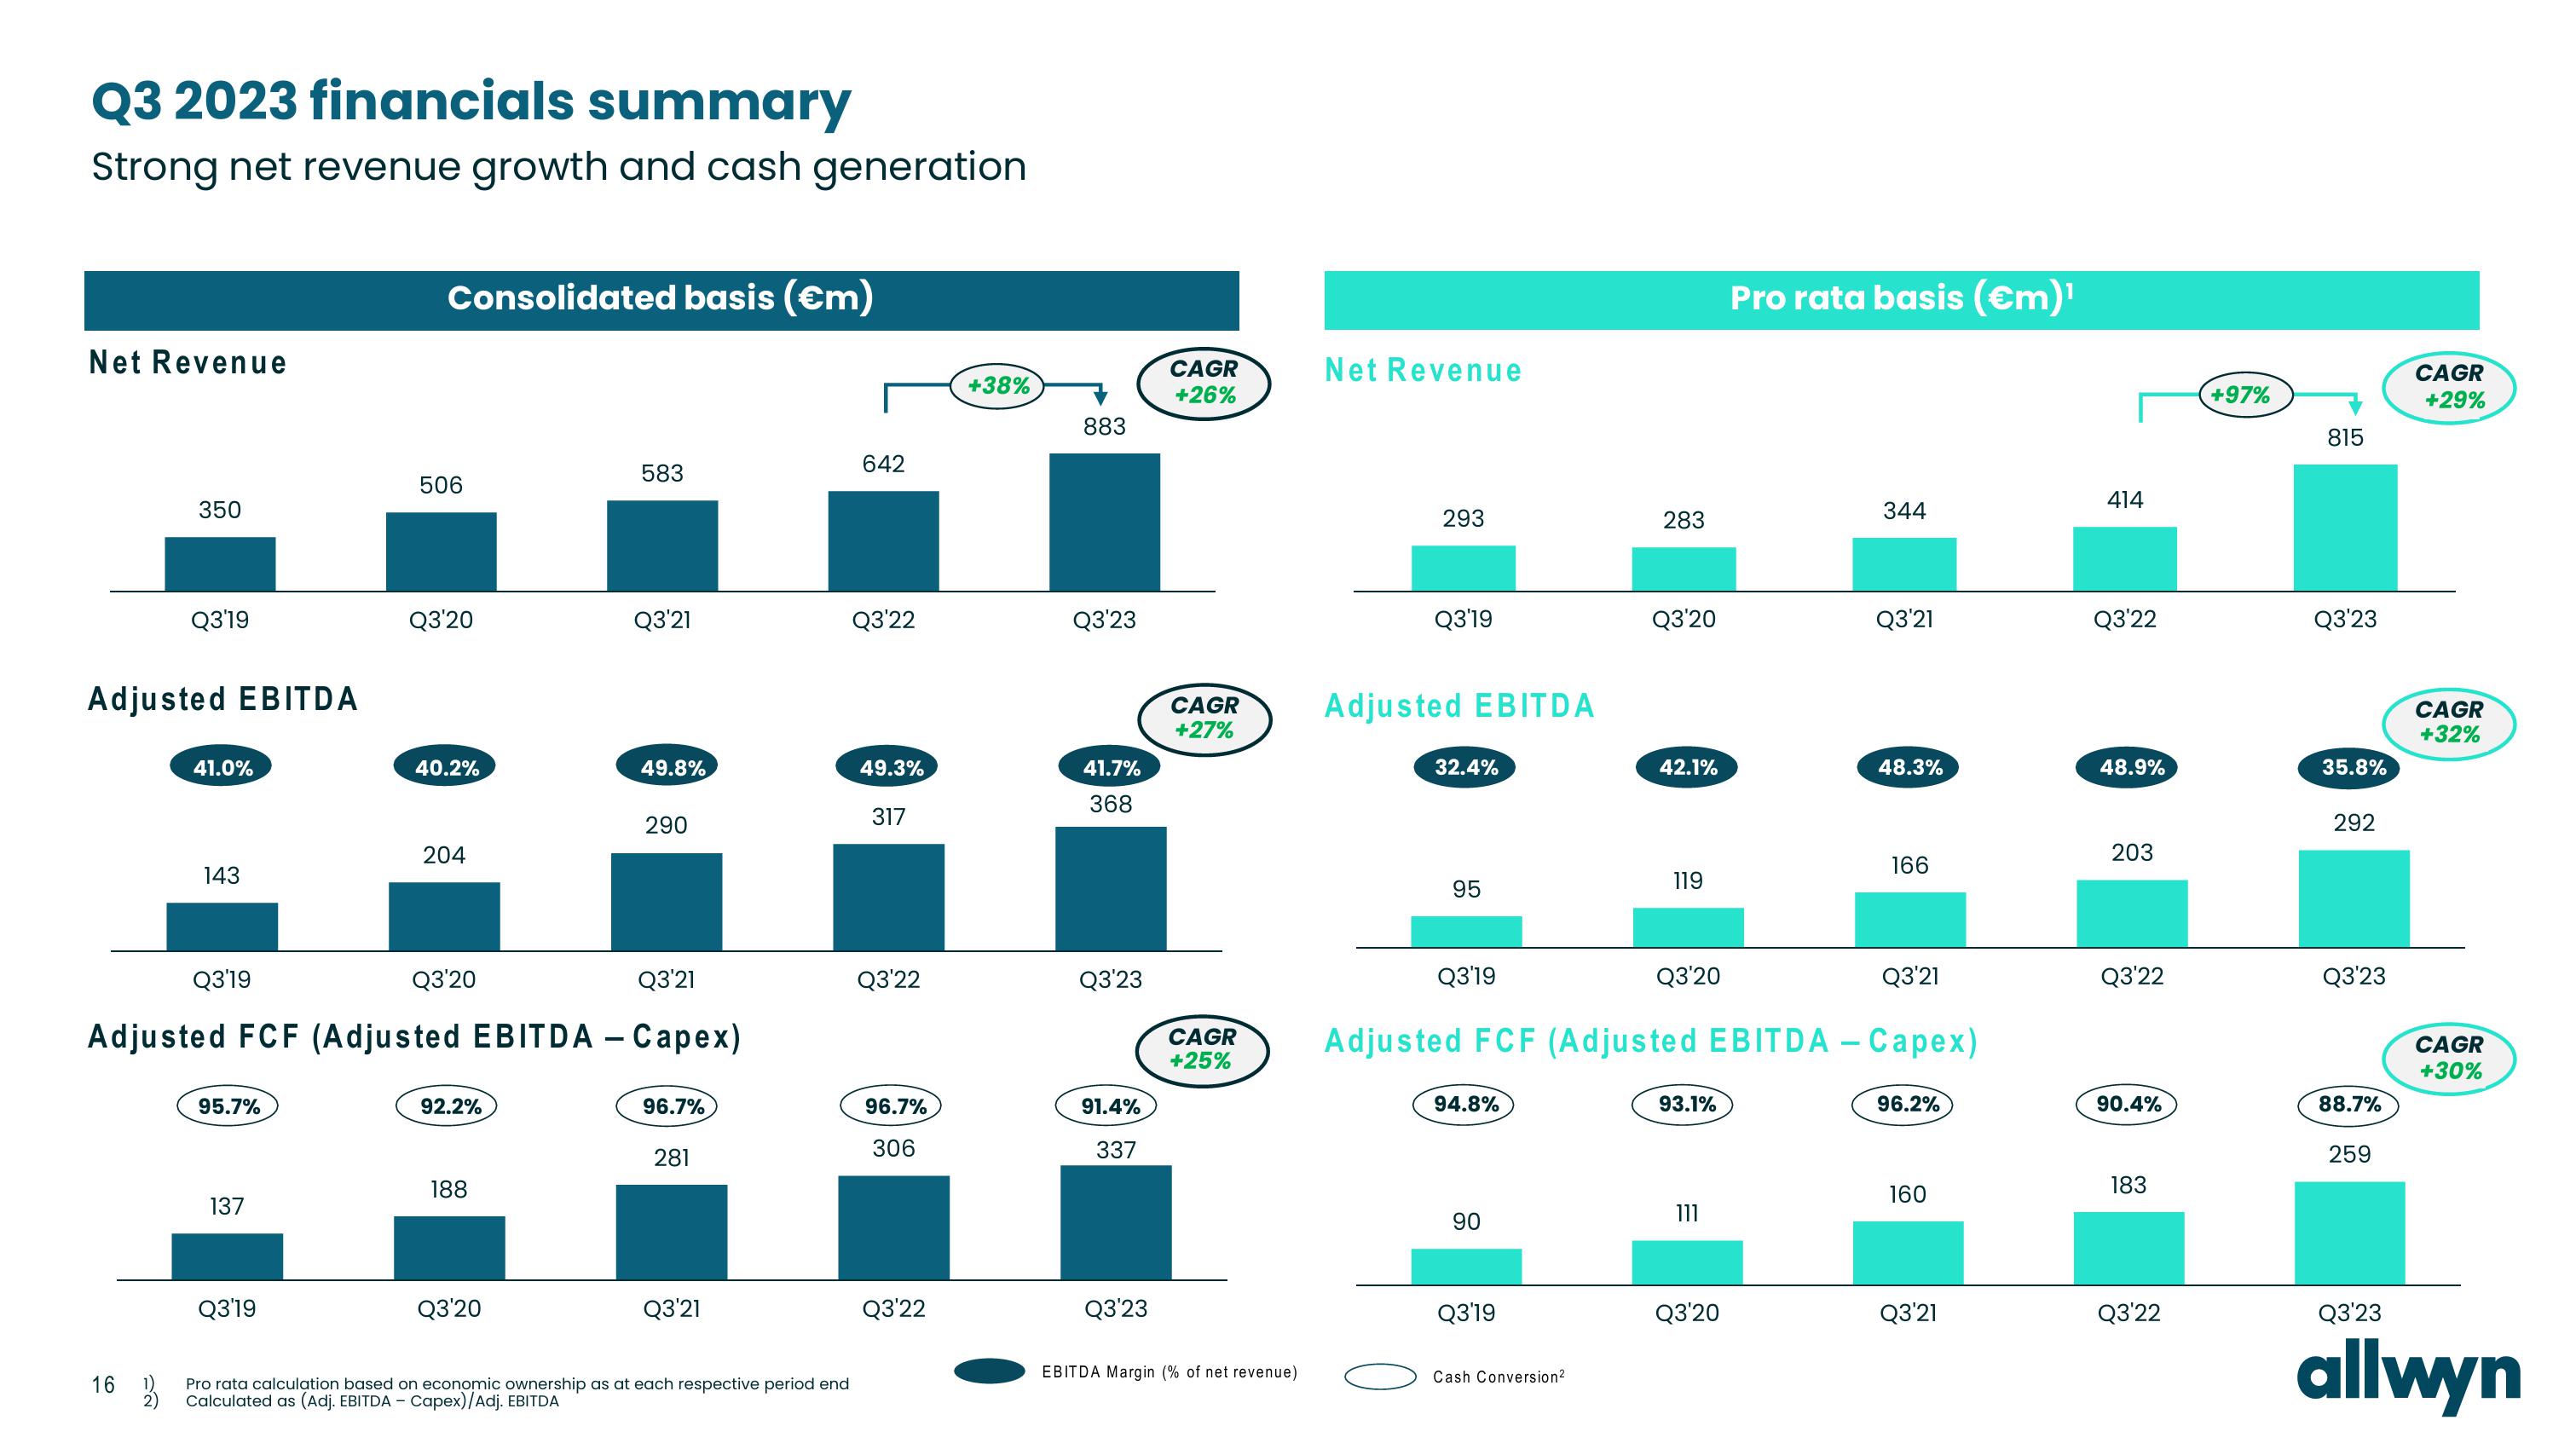
Q3 2023 financials summary
Strong net revenue growth and cash generation
Net Revenue
350
Adjusted EBITDA
16
Q3'19
1)
2)
41.0%
143
Q3'19
95.7%
137
Consolidated basis (€m)
Q3'19
506
Q3'20
40.2%
204
Q3'20
Q3'21
Adjusted FCF (Adjusted EBITDA - Capex)
92.2%
188
583
Q3'20
Q3'21
49.8%
290
96.7%
281
Q3'21
Pro rata calculation based on economic ownership as at each respective period end
Calculated as (Adj. EBITDA - Capex)/Adj. EBITDA
642
Q3'22
49.3%
317
Q3'22
96.7%
306
Q3'22
+38%
883
Q3'23
41.7%
368
Q3'23
91.4%
337
Q3'23
CAGR
+26%
CAGR
+27%
CAGR
+25%
EBITDA Margin (% of net revenue)
Net Revenue
293
Q3'19
Adjusted EBITDA
32.4%
95
Q3'19
94.8%
90
Q3'19
283
Cash Conversion²
Q3'20
42.1%
119
Q3'20
Q3'21
Adjusted FCF (Adjusted EBITDA - Capex)
93.1%
111
Pro rata basis (€m)¹
Q3'20
344
Q3'21
48.3%
166
96.2%
160
Q3'21
414
Q3'22
48.9%
203
Q3'22
90.4%
183
Q3'22
+97%
815
Q3'23
35.8%
292
Q3'23
88.7%
259
CAGR
+29%
CAGR
+32%
CAGR
+30%
Q3'23
allwynView entire presentation