Credit Suisse Investment Banking Pitch Book
CONFIDENTIAL
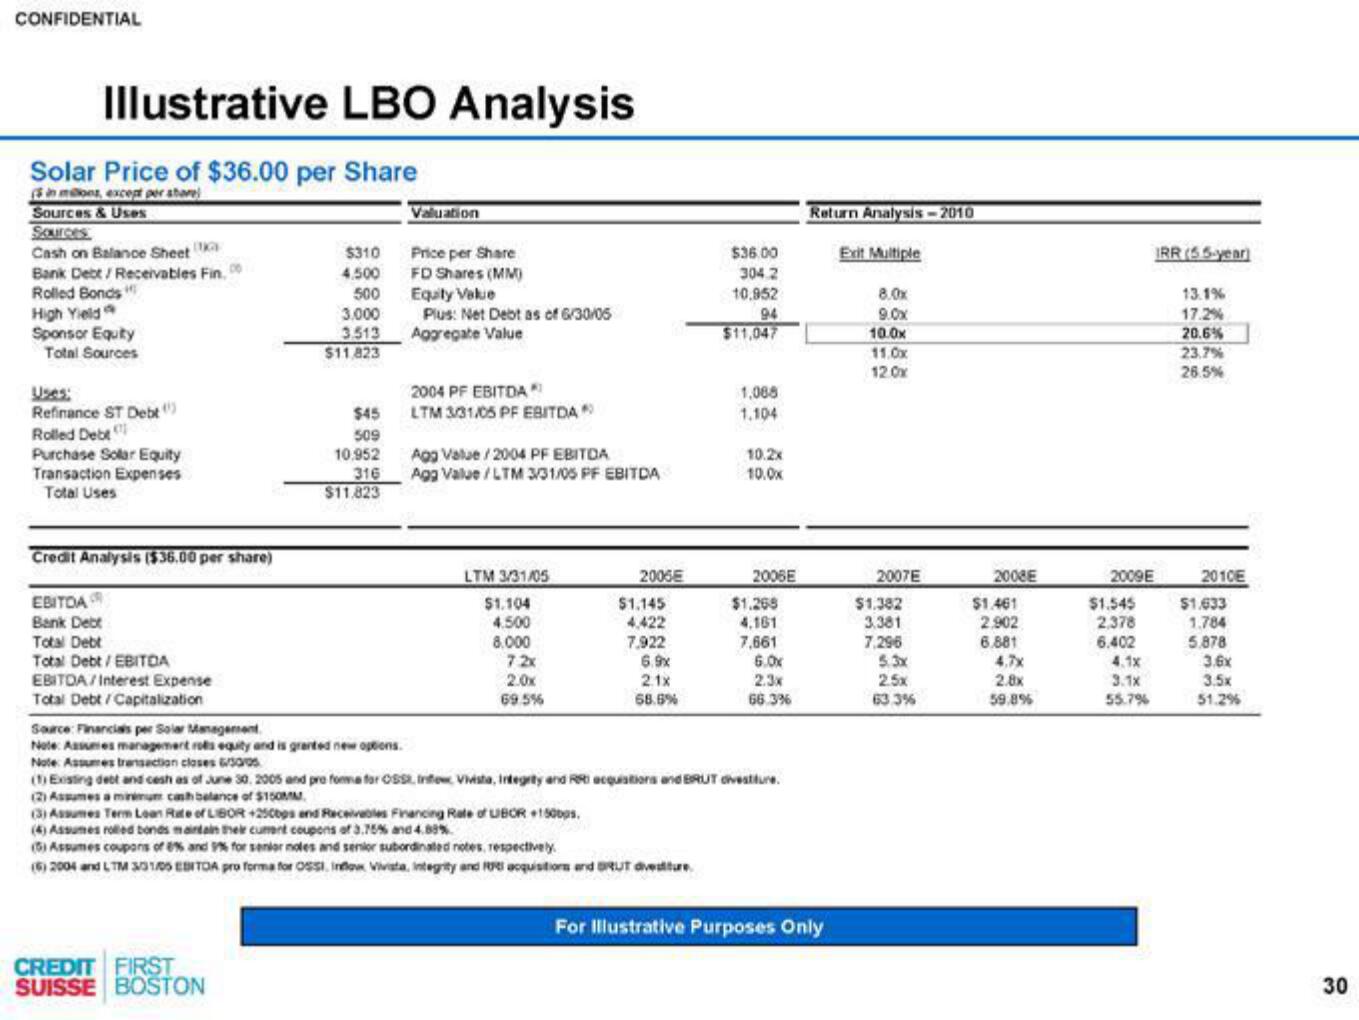
Illustrative LBO Analysis
Solar Price of $36.00 per Share
in mor, except per store
Sources & Uses
Sources
Cash on Balance Sheet
Bank Debt/Receivables Fin.00
Rolled Bonds
High Yield
Sponsor Equity
Total Sources
Uses:
Refinance ST Debt
Rolled Debt
Purchase Solar Equity
Transaction Expenses
Total Uses
Credit Analysis ($36.00 per share)
EBITDA
Bank Debt
Total Debt
Total Debt / EBITDA
EBITDA/Interest Expense
$310
4.500
500
3,000
3.513
$11.823
$45
509
10.952
316
$11.823
Total Debt/Capitalization
Source: Financials per Solar Management.
Note: Assumes management rols equity and is granted new options.
Note: Assumes transaction closes Gros
CREDIT FIRST
SUISSE BOSTON
Valuation
Price per Share
FD Shares (MM)
Equity Value
Plus: Net Debt as of 6/30/05
Aggregate Value
2004 PF EBITDA*
LTM 3/31/05 PF EBITDA*
Agg Value/2004 PF EBITDA
Agg Value/LTM 3/31/05 PF EBITDA
LTM 3/31/05
$1.104
4.500
8,000
7:2x
2.0x
69.5%
2006E
$1.145
4,422
7,922
6.9x
2.1x
68.6%
(3) Assumes Term Loan Rate of LIBOR +250bps and Receivables Financing Rate of UIBOR +150bps.
(4) Assumes rolled bonds maintain their cument coupons of 3.75% and 4.89%
(5) Assumes coupons of 8% and 9% for senior notes and senior subordinated notes, respectively.
(6) 2004 and LTM 3/31/05 EBITOA pro forma for OSSI, Inflow Vivista, Integrity and acquisitions and BRUT divestiture
$36.00
304.2
10,952
94
$11,047
1,068
1.104
10.2x
10.0x
2006E
$1.269
4,161
7,661
(1) Existing debt and cesh as of June 30, 2005 and pro forma for OSS, Info Vivista, Integrity and RR acquisitions and BRUT desture.
(2) Assumes a minimum cash belance of $150MM
6.0x
2.3x
66.3%
Return Analysis-2010
For Illustrative Purposes Only
Exit Multiple
8.0x
9.0x
10.0x
11.0x
12.0x
2007E
$1.382
3.381
7,296
5.3x
2.5x
63.3%
2008E
$1.461
2.902
6.881
2.8x
59.8%
2009E
$1.545
2,378
6.402
IRR (5.5-year)
4.1x
3.1x
55.7%
13.1%
17.2%
20.6%
23.7%
26.5%
2010E
$1,633
1.784
5.878
3.6x
3.5x
51.2%
30View entire presentation