Avantor Results Presentation Deck slide image

Avantor Results Presentation Deck

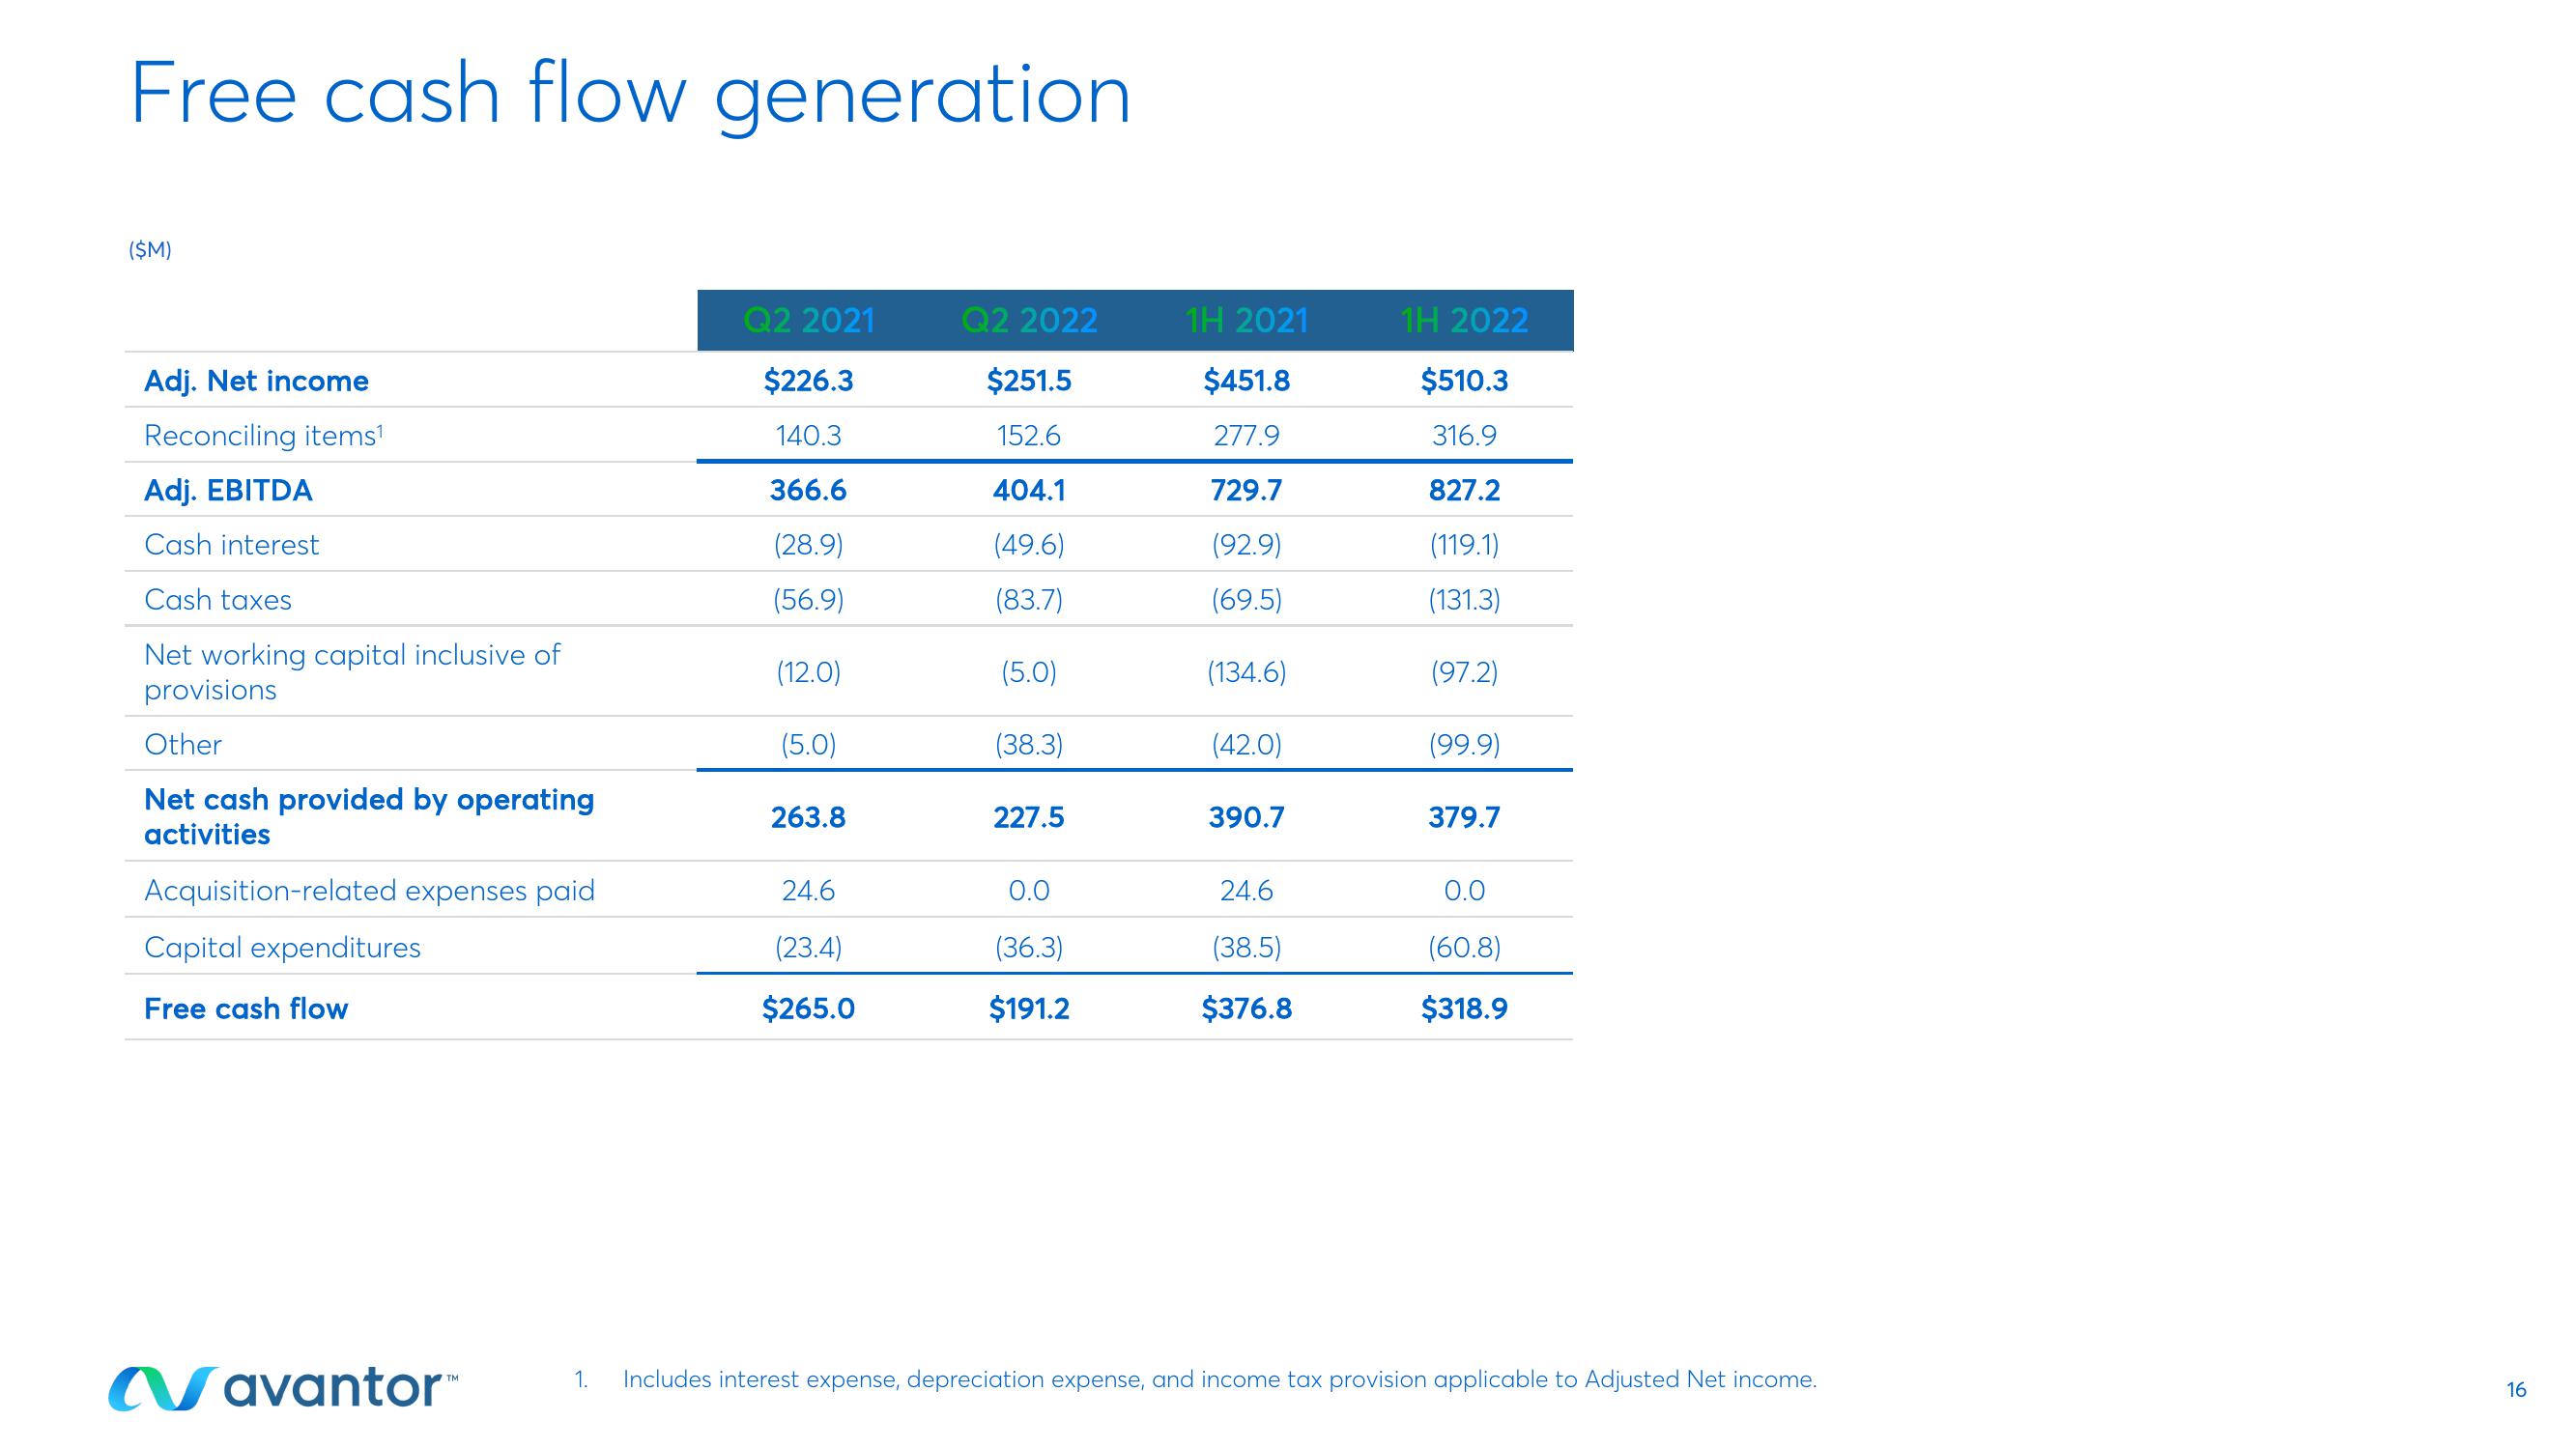
Free cash flow generation ($M) Adj. Net income Reconciling items¹ Adj. EBITDA Cash interest Cash taxes Net working capital inclusive of provisions Other Net cash provided by operating activities Acquisition-related expenses paid Capital expenditures Free cash flow Navantor™ 1. Q2 2021 $226.3 140.3 366.6 (28.9) (56.9) (12.0) (5.0) 263.8 24.6 (23.4) $265.0 Q2 2022 $251.5 152.6 404.1 (49.6) (83.7) (5.0) (38.3) 227.5 0.0 (36.3) $191.2 1H 2021 $451.8 277.9 729.7 (92.9) (69.5) (134.6) (42.0) 390.7 24.6 (38.5) $376.8 1H 2022 $510.3 316.9 827.2 (119.1) (131.3) (97.2) (99.9) 379.7 0.0 (60.8) $318.9 Includes interest expense, depreciation expense, and income tax provision applicable to Adjusted Net income. 16
View entire presentation