J.P.Morgan Results Presentation Deck
JPMORGAN CHASE & CO.
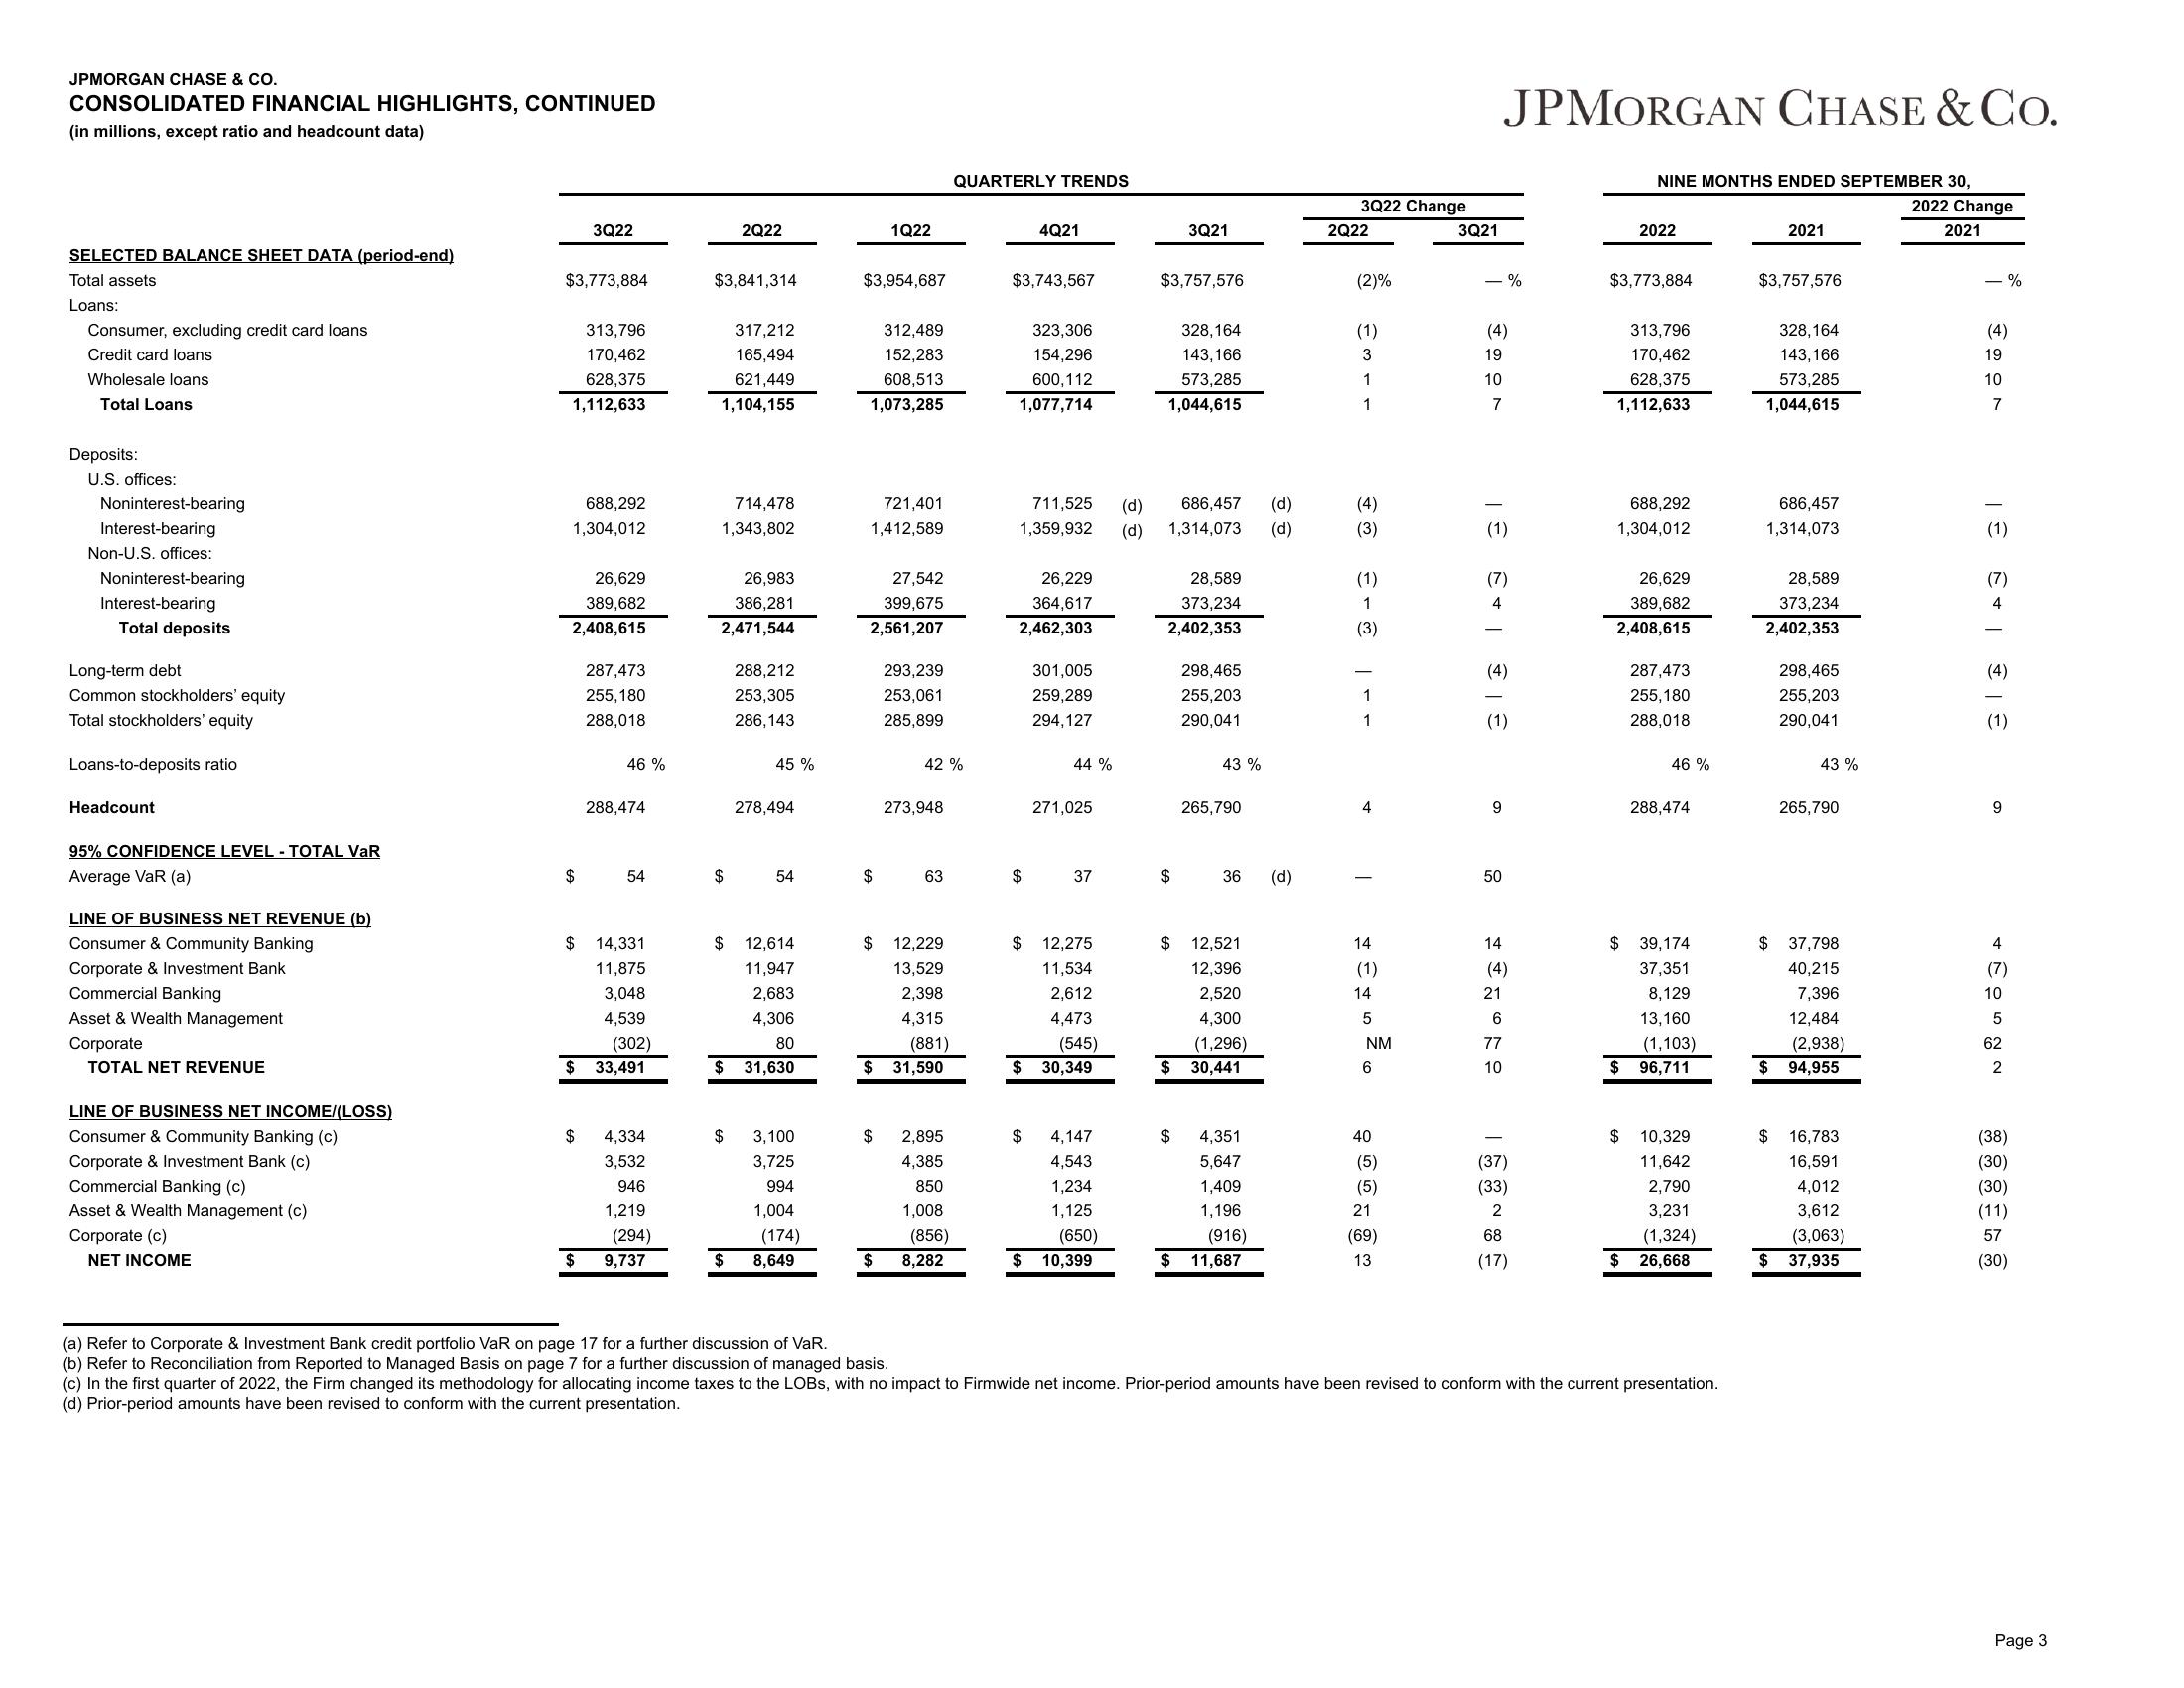
CONSOLIDATED FINANCIAL HIGHLIGHTS, CONTINUED
(in millions, except ratio and headcount data)
SELECTED BALANCE SHEET DATA (period-end)
Total assets
Loans:
Consumer, excluding credit card loans
Credit card loans
Wholesale loans.
Total Loans
Deposits:
U.S. offices:
Noninterest-bearing
Interest-bearing
Non-U.S. offices:
Noninterest-bearing
Interest-bearing
Total deposits
Long-term debt
Common stockholders' equity
Total stockholders' equity
Loans-to-deposits ratio
Headcount
95% CONFIDENCE LEVEL - TOTAL VAR
Average VaR (a)
LINE OF BUSINESS NET REVENUE (b)
Consumer & Community Banking
Corporate & Investment Bank
Commercial Banking
Asset & Wealth Management
Corporate
TOTAL NET REVENUE
LINE OF BUSINESS NET INCOME/(LOSS)
Consumer & Community Banking (c)
Corporate & Investment Bank (c)
Commercial Banking (c)
Asset & Wealth Management (c)
Corporate (c)
NET INCOME
$3,773,884
313,796
170,462
628,375
1,112,633
688,292
1,304,012
3Q22
26,629
389,682
2,408,615
$
$
$
$
287,473
255,180
288,018
46 %
288,474
54
14,331
11,875
3,048
4,539
$ 33,491
(302)
4,334
3,532
946
1,219
(294)
9,737
2Q22
$3,841,314
317,212
165,494
621,449
1,104,155
714,478
1,343,802
26,983
386,281
2,471,544
$
288,212
253,305
286,143
45 %
278,494
54
$ 12,614
11,947
2,683
4,306
80
$ 31,630
3,100
3,725
994
1,004
(174)
$ 8,649
$3,954,687
312,489
152,283
608,513
1,073,285
1Q22
721,401
1,412,589
27,542
399,675
2,561,207
$
$
293,239
253,061
285,899
$
42 %
273,948
$ 12,229
13,529
2,398
4,315
63
(881)
$ 31,590
2,895
4,385
850
1,008
(856)
QUARTERLY TRENDS
8,282
4Q21
$3,743,567
323,306
154,296
600,112
1,077,714
711,525 (d)
1,359,932 (d)
26,229
364,617
2,462,303
$
301,005
259,289
294,127
44 %
271,025
37
$ 12,275
11,534
2,612
4,473
(545)
$ 30,349
$ 4,147
4,543
1,234
1,125
(650)
$ 10,399
$3,757,576
328,164
143,166
573,285
1,044,615
686,457 (d)
1,314,073 (d)
3Q21
28,589
373,234
2,402,353
$
$
$
$
298,465
255,203
290,041
43%
$ 12,521
12,396
2,520
4,300
(1,296)
30,441
265,790
36 (d)
4,351
5,647
1,409
1,196
(916)
11,687
3Q22 Change
2Q22
(2)%
(1)
3
1
1
(4)
(3)
(1)
(3)
|--
4
T
14
(1)
14
5
NM
6
40
(5)
(5)
21
(69)
13
3Q21
- %
(4)
19
10
7
(1)
JPMORGAN CHASE & CO.
+ €
(7)
(4)
9
50
14
(4)
21
6
10
(37)
(33)
2
68
(17)
NINE MONTHS ENDED SEPTEMBER 30,
2022
$3,773,884
313,796
170,462
628,375
1,112,633
688,292
1,304,012
26,629
389,682
2,408,615
$
287,473
255,180
288,018
46 %
288,474
$ 39,174
37,351
8,129
13,160
(1,103)
$ 96,711
10,329
11,642
2,790
3,231
(1,324)
$ 26,668
(a) Refer to Corporate & Investment Bank credit portfolio VaR on page 17 for a further discussion of VaR.
(b) Refer to Reconciliation from Reported to Managed Basis on page 7 for a further discussion of managed basis.
(c) In the first quarter of 2022, the Firm changed its methodology for allocating income taxes to the LOBS, with no impact to Firmwide net income. Prior-period amounts have been revised to conform with the current presentation.
(d) Prior-period amounts have been revised to conform with the current presentation.
2021
$3,757,576
328,164
143,166
573,285
1,044,615
686,457
1,314,073
28,589
373,234
2,402,353
$
298,465
255,203
290,041
43 %
265,790
$ 37,798
40,215
7,396
12,484
(2,938)
94,955
16,783
16,591
4,012
3,612
(3,063)
$ 37,935
2022 Change
2021
- %
(4)
19
10
7
(1)
(7)
4
1
(4)
(1)
9
NÅGONA
(7)
62
(38)
(30)
(30)
(11)
57
(30)
Page 3View entire presentation