Kering Investor Presentation Deck
- REVENUE
(in €m, and comparable growth in %)
3,072
H1 2020
●
-
% comp.
+59%
W. Europe
N. America
Japan
APAC
ROW
Total
Retail
-10%
Retail (91% of H1 sales)
Q2
+75%
+225%
+85%
+48%
+345%
+93%
Wholesale
+62%
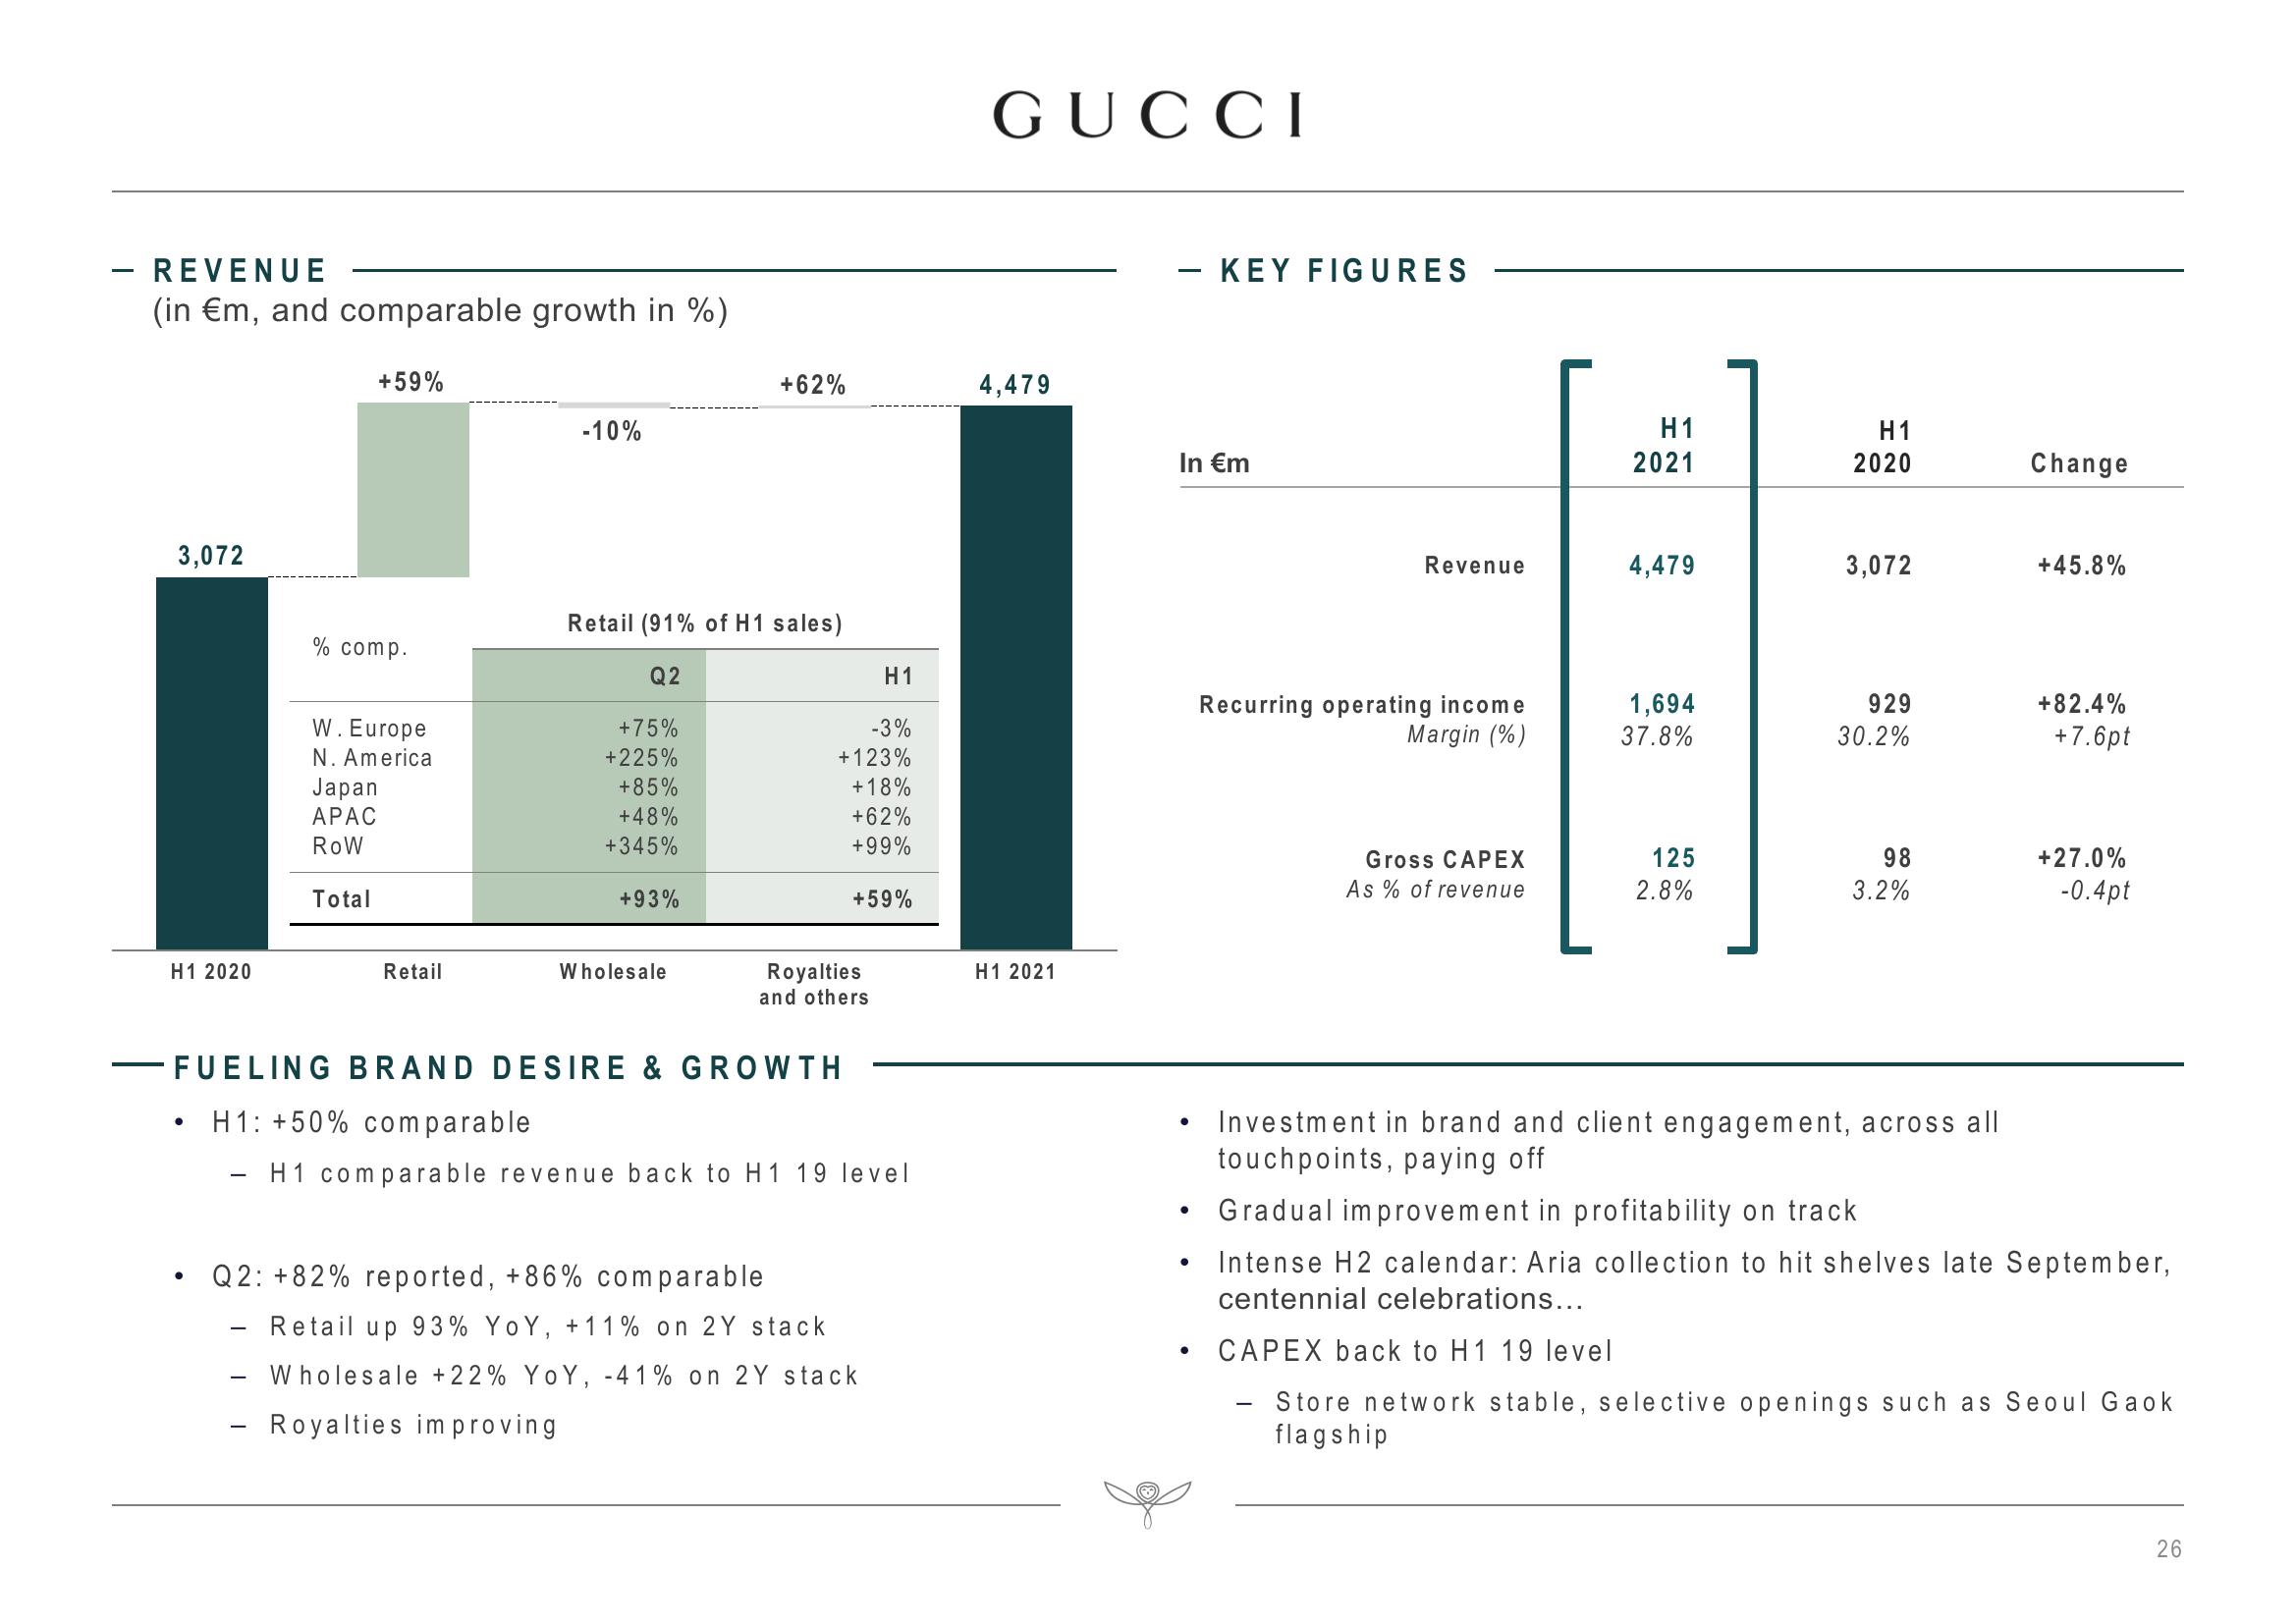
Q2: +82% reported, +86% comparable
-3%
+123%
+18%
+62%
+99%
Royalties
and others
FUELING BRAND DESIRE & GROWTH
H1: +50% comparable
H1 comparable revenue back to H1 19 level
H1
+59%
Retail up 93% YoY, +11% on 2Y stack
- Wholesale +22% YoY, -41% on 2Y stack
Royalties improving
GUCCI
4,479
H1 2021
- KEY FIGURES
In €m
●
●
●
●
Revenue
Recurring operating income
Margin (%)
Gross CAPEX
As % of revenue
H1
2021
4,479
1,694
37.8%
125
2.8%
H1
2020
3,072
929
30.2%
98
3.2%
Investment in brand and client engagement, across all
touchpoints, paying off
Change
+45.8%
+82.4%
+7.6pt
+27.0%
-0.4pt
Gradual improvement in profitability on track
Intense H2 calendar: Aria collection to hit shelves late September,
centennial celebrations...
CAPEX back to H1 19 level
Store network stable, selective openings such as Seoul Gaok
flagship
26View entire presentation