Tudor, Pickering, Holt & Co Investment Banking
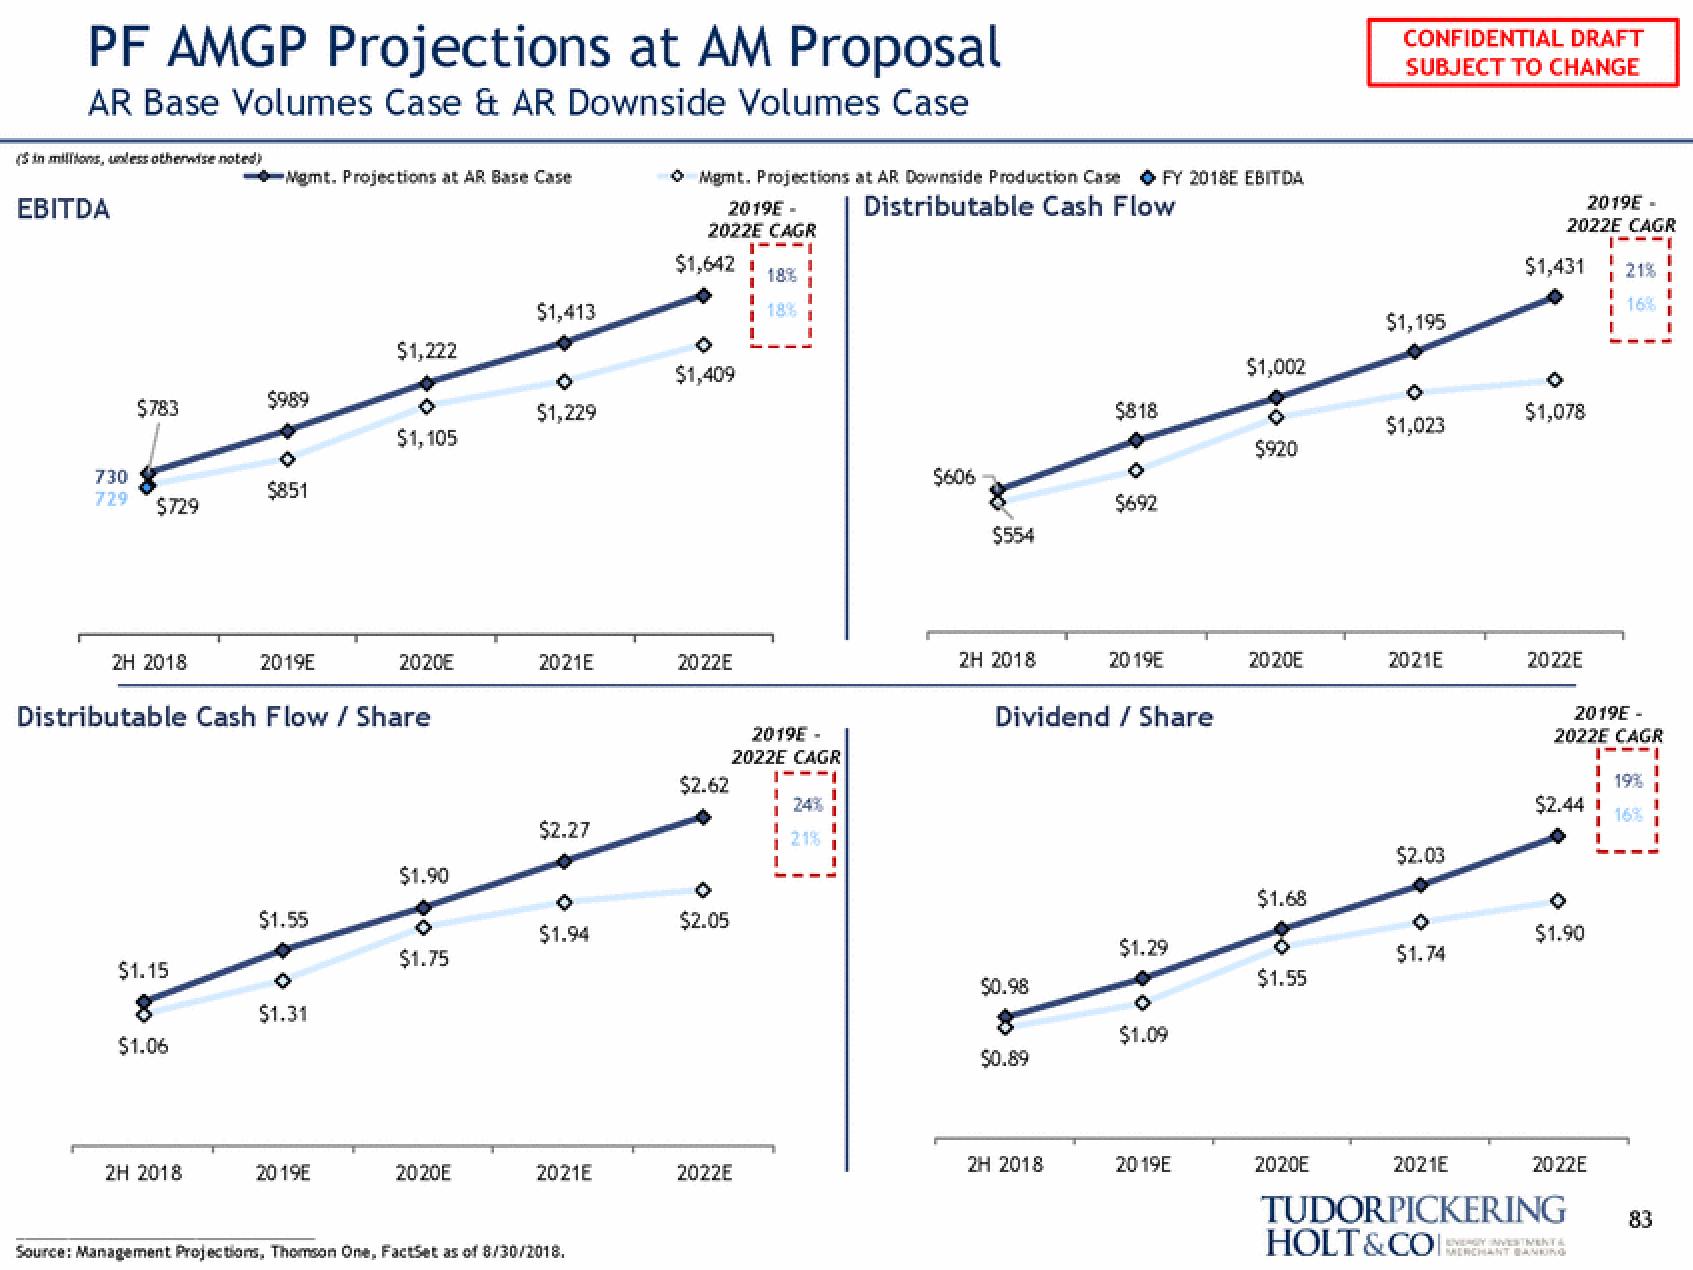
PF AMGP Projections at AM Proposal
AR Base Volumes Case & AR Downside Volumes Case
(in millions, unless otherwise noted)
EBITDA
$783
730
729 $729
2H 2018
$1.15
$1.06
Mgmt. Projections at AR Base Case
2H 2018
$989
$851
2019E
Distributable Cash Flow / Share
$1.55
0
$1.31
$1,222
2019E
$1,105
2020E
$1.90
$1.75
2020E
$1,413
$1,229
2021E
$2.27
O
$1.94
2021E
Source: Management Projections, Thomson One, FactSet as of 8/30/2018.
ⒸMgmt. Projections at AR Downside Production Case FY 2018E EBITDA
Distributable Cash Flow
2019E-
2022E CAGR
1---1
18%
18%
$1,642 i
$1,409
2022E
$2.62
$2.05
I
2019E-
2022E CAGR
2022E
24%
21%
I
$606
$554
2H 2018
$0.98
$0.89
$818
Dividend / Share
2H 2018
$692
2019E
$1.29
$1.09
2019E
$1,002
$920
2020E
$1.68
$1.55
CONFIDENTIAL DRAFT
SUBJECT TO CHANGE
2020E
$1,195
$1,023
2021E
$2.03
0
$1.74
2019E-
2022E CAGR
1-
$1,431
$1,078
2022E
2019E-
2022E CAGR
1---1
19%
16%
$2.44
$1.90
1
2022E
21%
16%
I
1
I
2021E
TUDORPICKERING 83
HOLT&COCHANT BANKING
1View entire presentation