Hydrafacial Results Presentation Deck slide image

Hydrafacial Results Presentation Deck

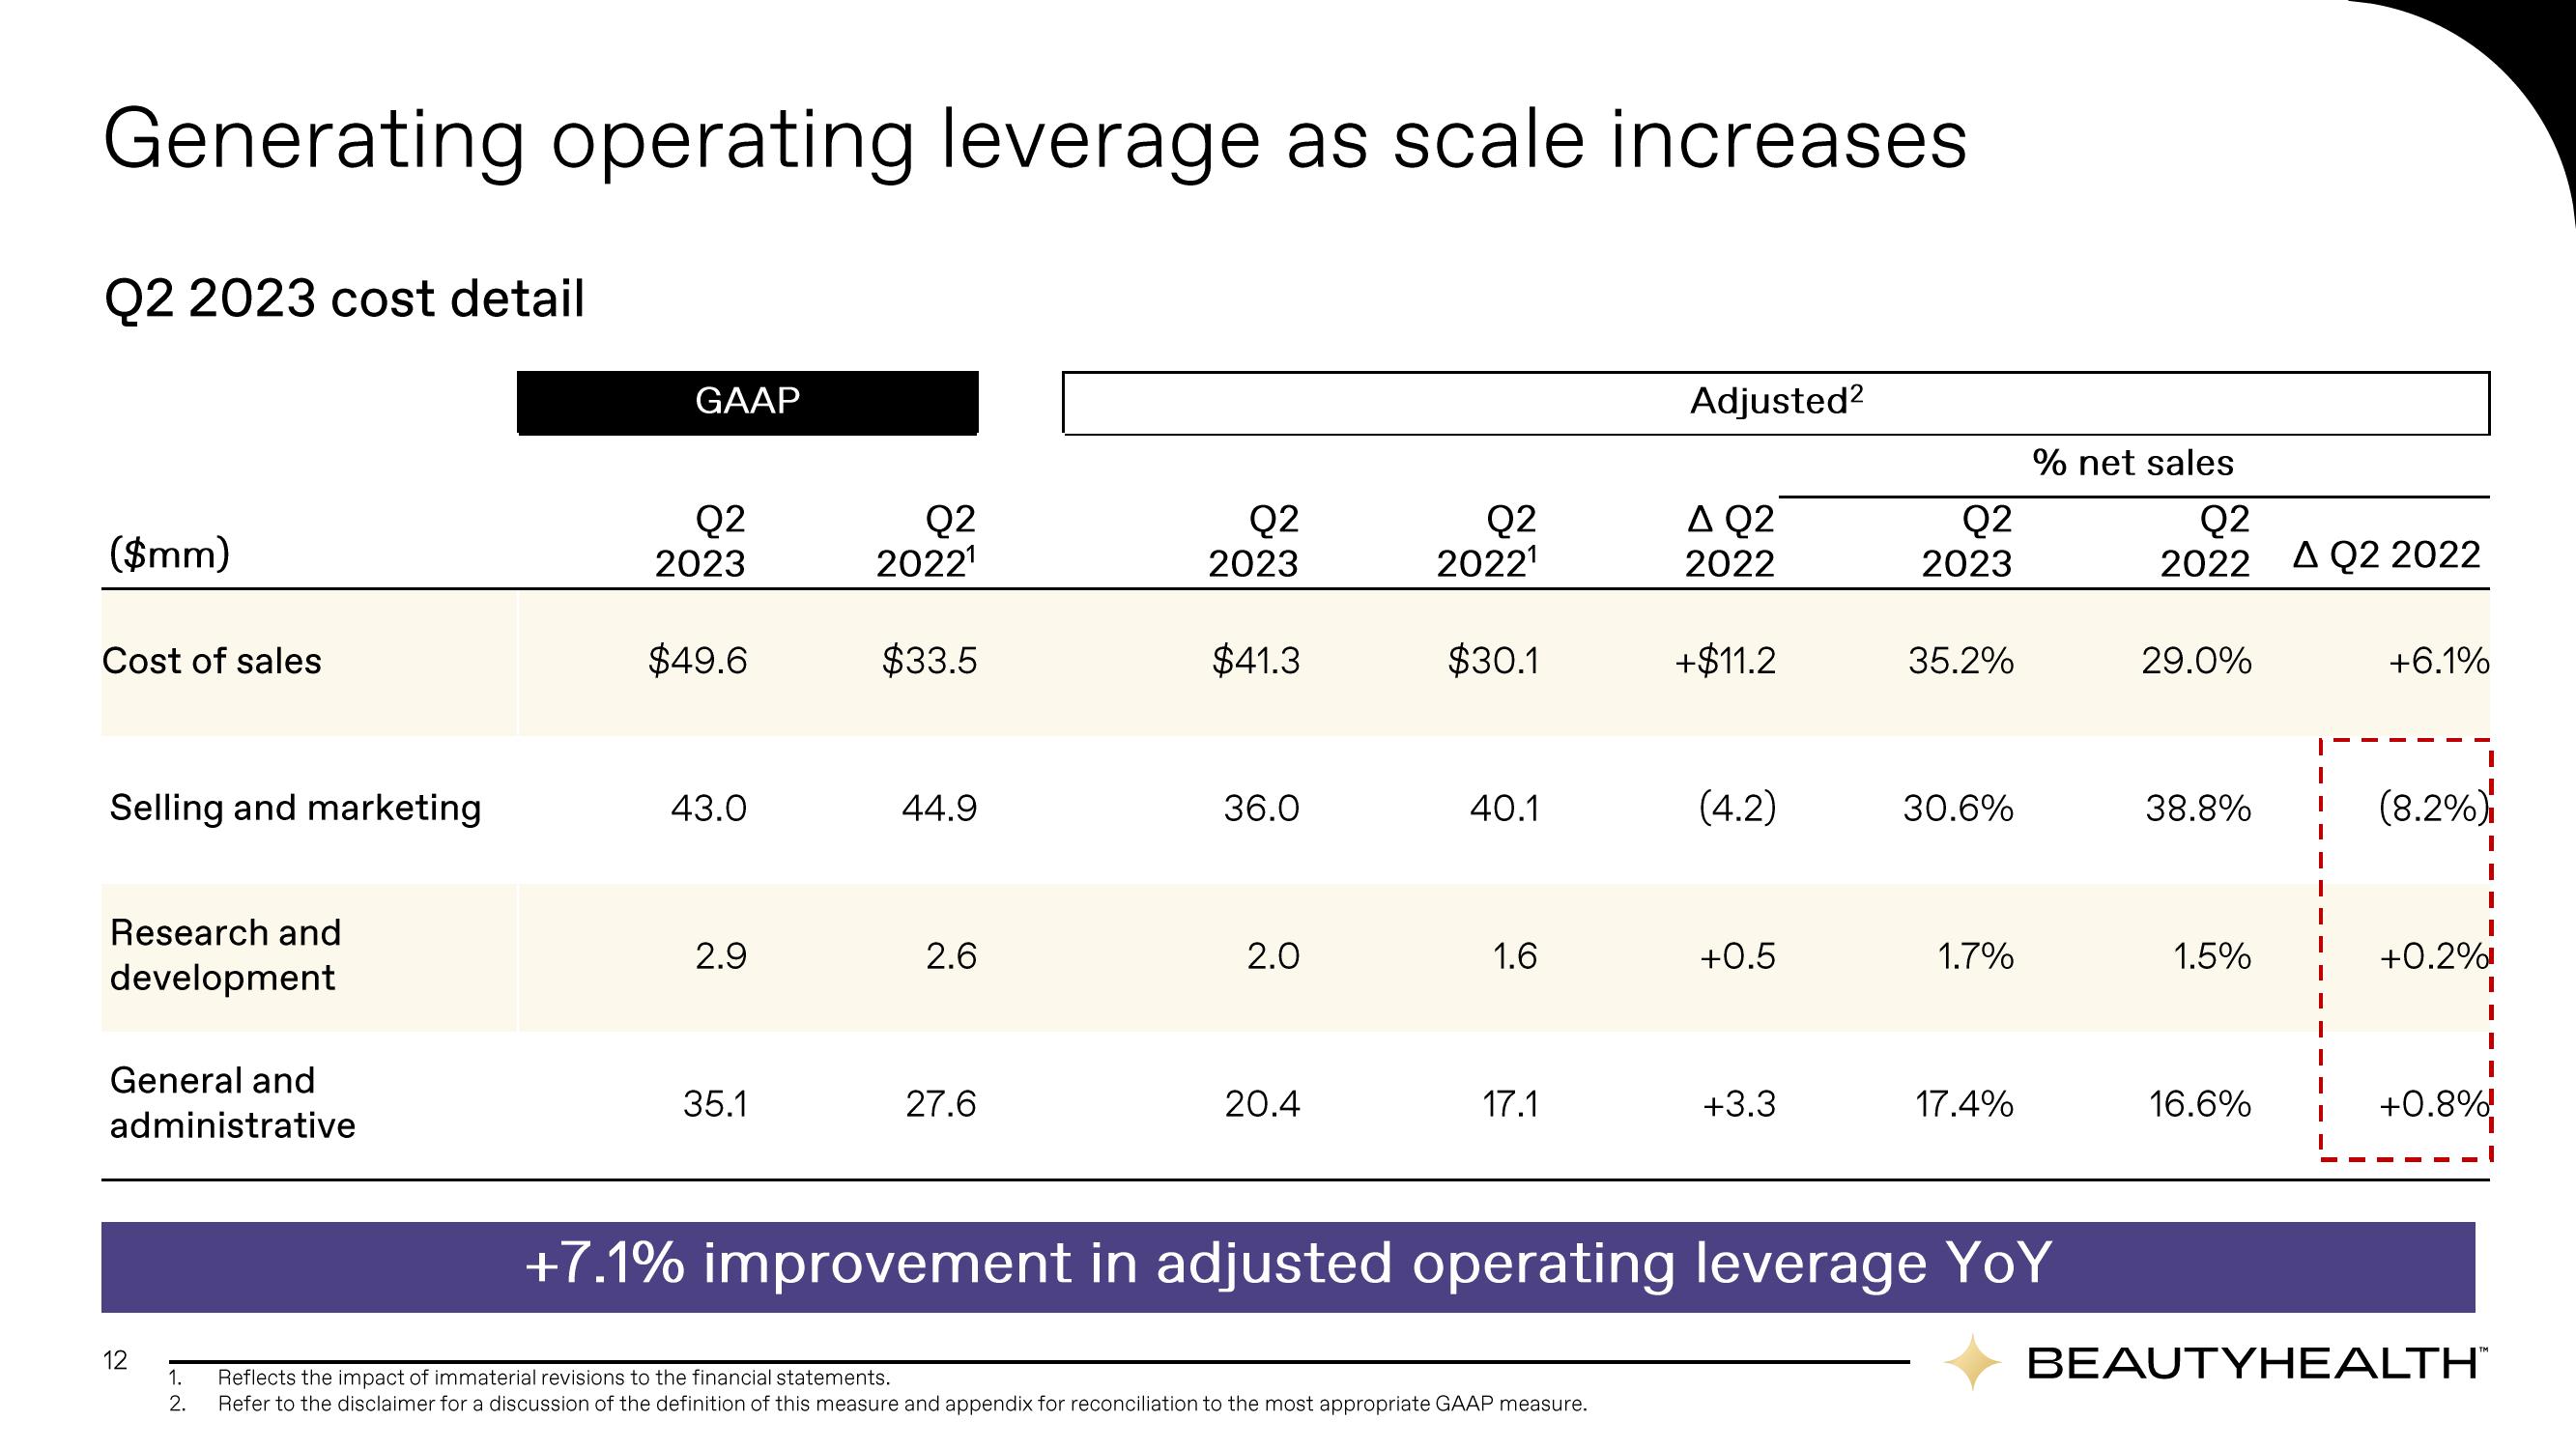
Generating operating leverage as scale increases Q2 2023 cost detail ($mm) Cost of sales Selling and marketing Research and development General and administrative 12 1. 2. GAAP 02 2023 $49.6 43.0 2.9 35.1 Q2 2022¹ $33.5 44.9 2.6 27.6 Q2 2023 $41.3 36.0 2.0 20.4 Q2 2022¹ $30.1 40.1 1.6 17.1 Adjusted² Reflects the impact of immaterial revisions to the financial statements. Refer to the disclaimer for a discussion of the definition of this measure and appendix for reconciliation to the most appropriate GAAP measure. A Q2 2022 +$11.2 (4.2) +0.5 +3.3 Q2 2023 35.2% 30.6% 1.7% 17.4% % net sales Q2 2022 AQ2 2022 +7.1% improvement in adjusted operating leverage YoY 29.0% 38.8% 1.5% 16.6% +6.1% (8.2%) +0.2% +0.8% BEAUTYHEALTH™
View entire presentation