First Merchants Results Presentation Deck
Business Highlights
Northwest Indiana
Lake County Rank: 6
Lafayette MSA Rank: 2
Deposits: $3.3B
Loans: $2.1B
Michigan
Monroe MSA Rank: 1
Detroit MSA Rank: 9
Deposits: $2.8B
Loans: $2.4B
Northeast Indiana
Muncie MSA Rank: 1
Ft Wayne MSA Rank: 4
Deposits: $4.6B
Loans: $2.3B
Indianapolis
Indianapolis MSA Rank: 7
Deposits: $3.3B
Loans: $4.0B
MSA and County ranking data per FDIC
¹Commercial includes Public Funds and Consumer includes Private Wealth
Columbus
Columbus MSA Rank: 12
Deposits: $0.6B
Loans: $1.5B
First Merchants Corporation
Helping you prosper
Commercial
Consumer
Mortgage
Total Loan Growth QTD
Total Loan Growth YTD
*Adjusted Total Loan Growth QTD
*Adjusted Total Loan Growth YTD
■
I
Loan Growth Annualized¹
2Q23 Balance ($B)
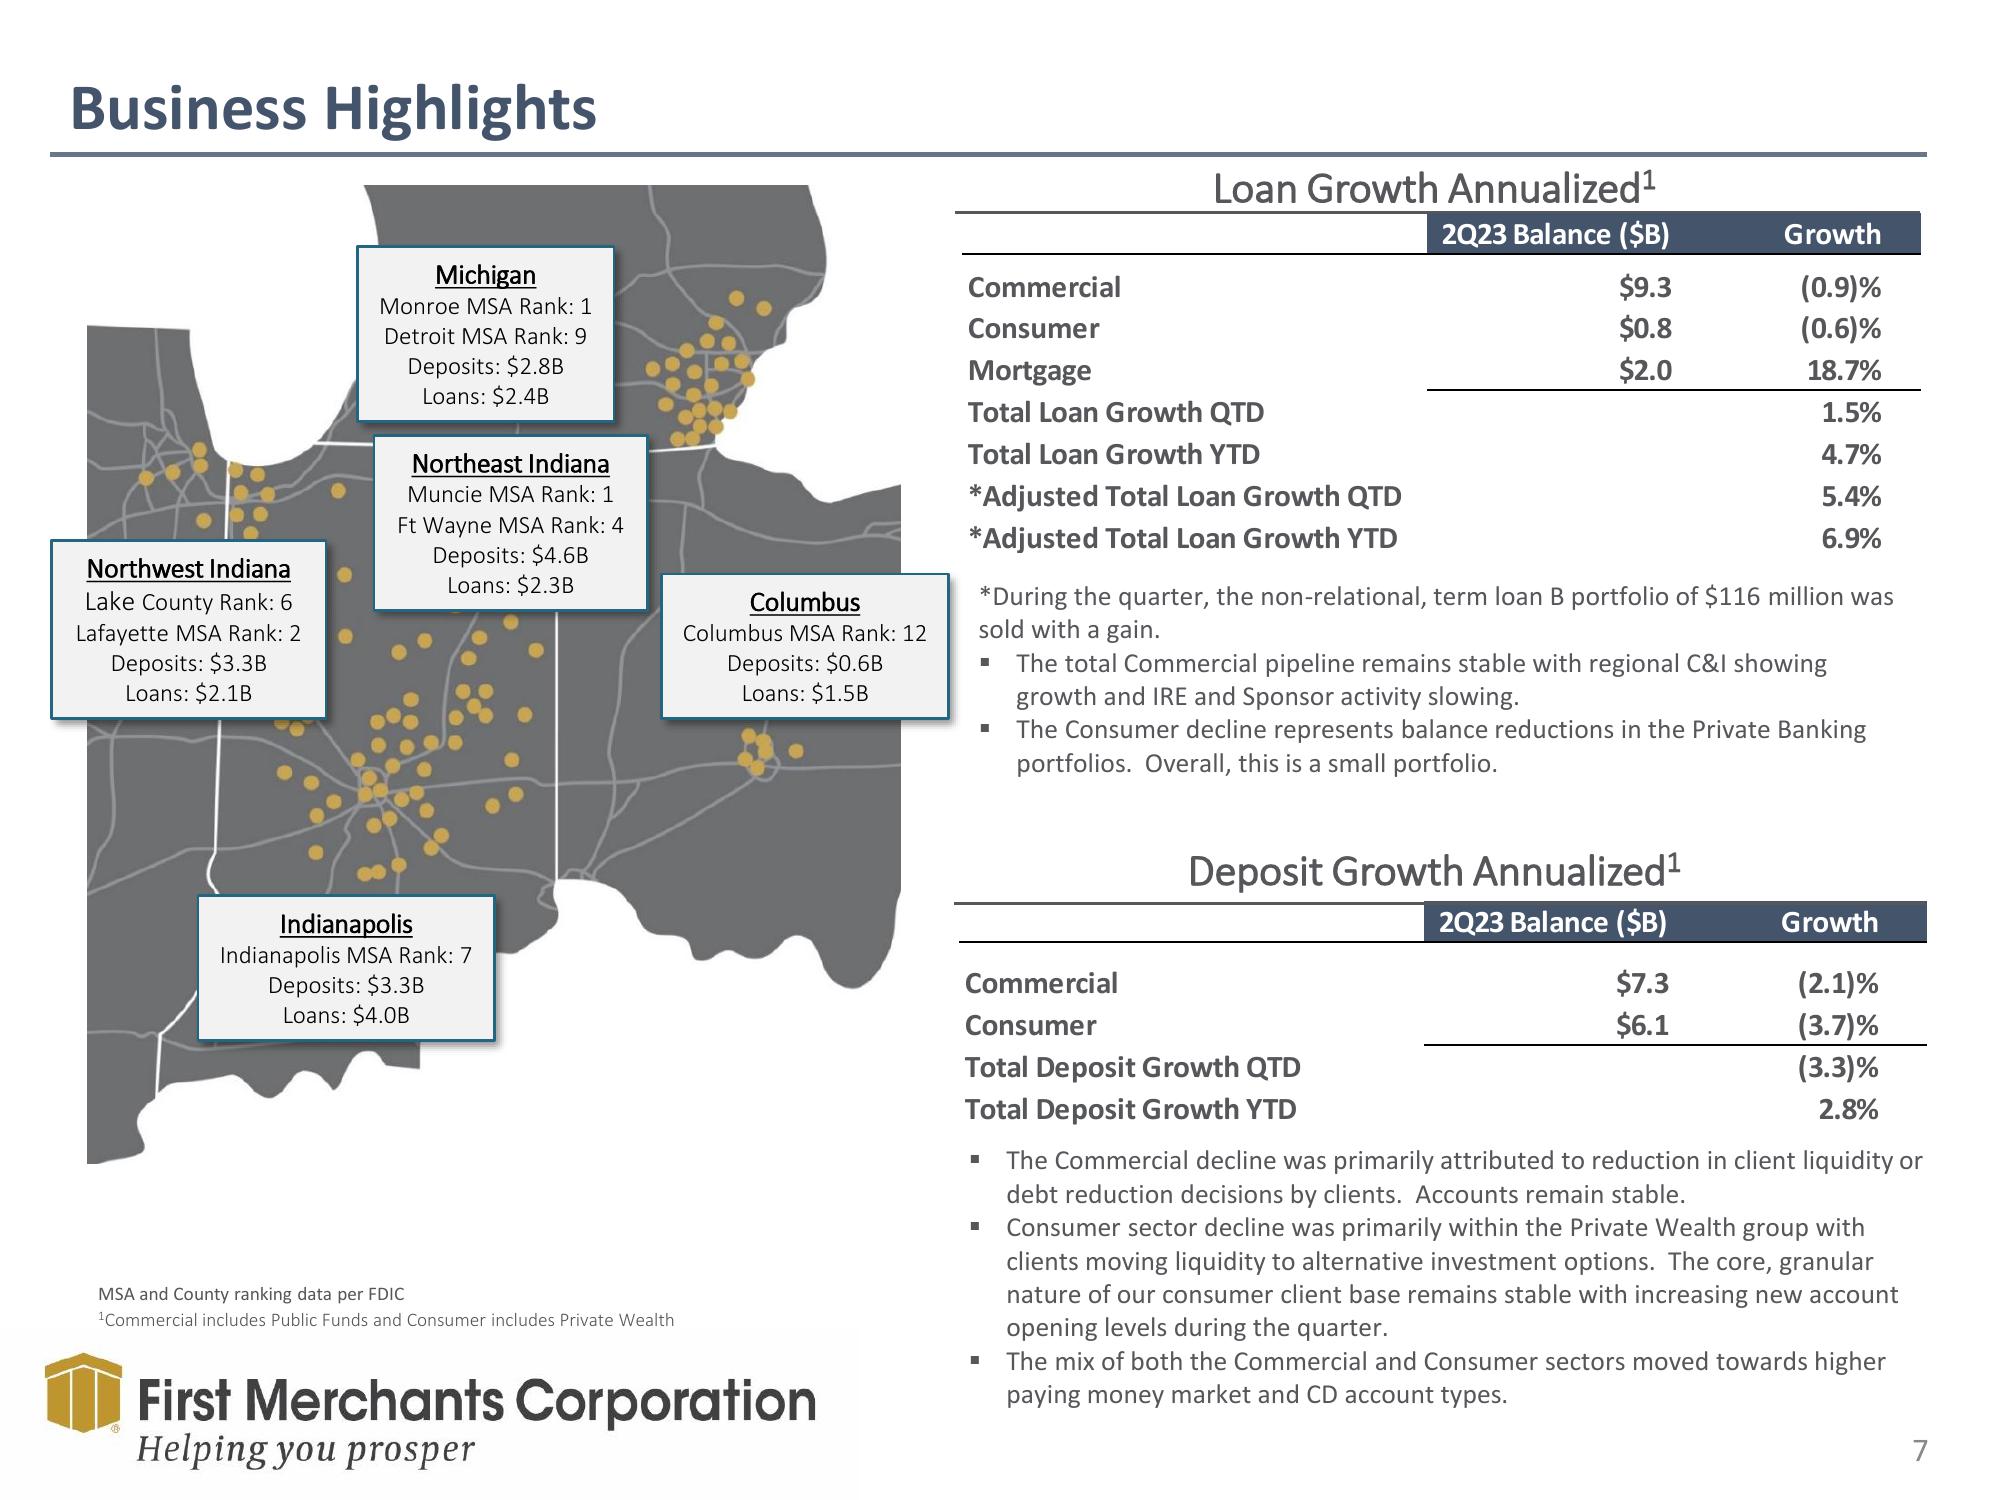
*During the quarter, the non-relational, term loan B portfolio of $116 million was
sold with a gain.
The total Commercial pipeline remains stable with regional C&I showing
growth and IRE and Sponsor activity slowing.
The Consumer decline represents balance reductions in the Private Banking
portfolios. Overall, this is a small portfolio.
Commercial
Consumer
Total Deposit Growth QTD
Total Deposit Growth YTD
■
$9.3
$0.8
$2.0
■
Deposit Growth Annualized¹
2Q23 Balance ($B)
Growth
(0.9)%
(0.6)%
18.7%
1.5%
4.7%
5.4%
6.9%
$7.3
$6.1
The Commercial decline was primarily attributed to reduction in client liquidity or
debt reduction decisions by clients. Accounts remain stable.
Consumer sector decline was primarily within the Private Wealth group with
clients moving liquidity to alternative investment options. The core, granular
nature of our consumer client base remains stable with increasing new account
opening levels during the quarter.
■ The mix of both the Commercial and Consumer sectors moved towards higher
paying money market and CD account types.
Growth
(2.1)%
(3.7)%
(3.3)%
2.8%
7View entire presentation