Bright Machines SPAC
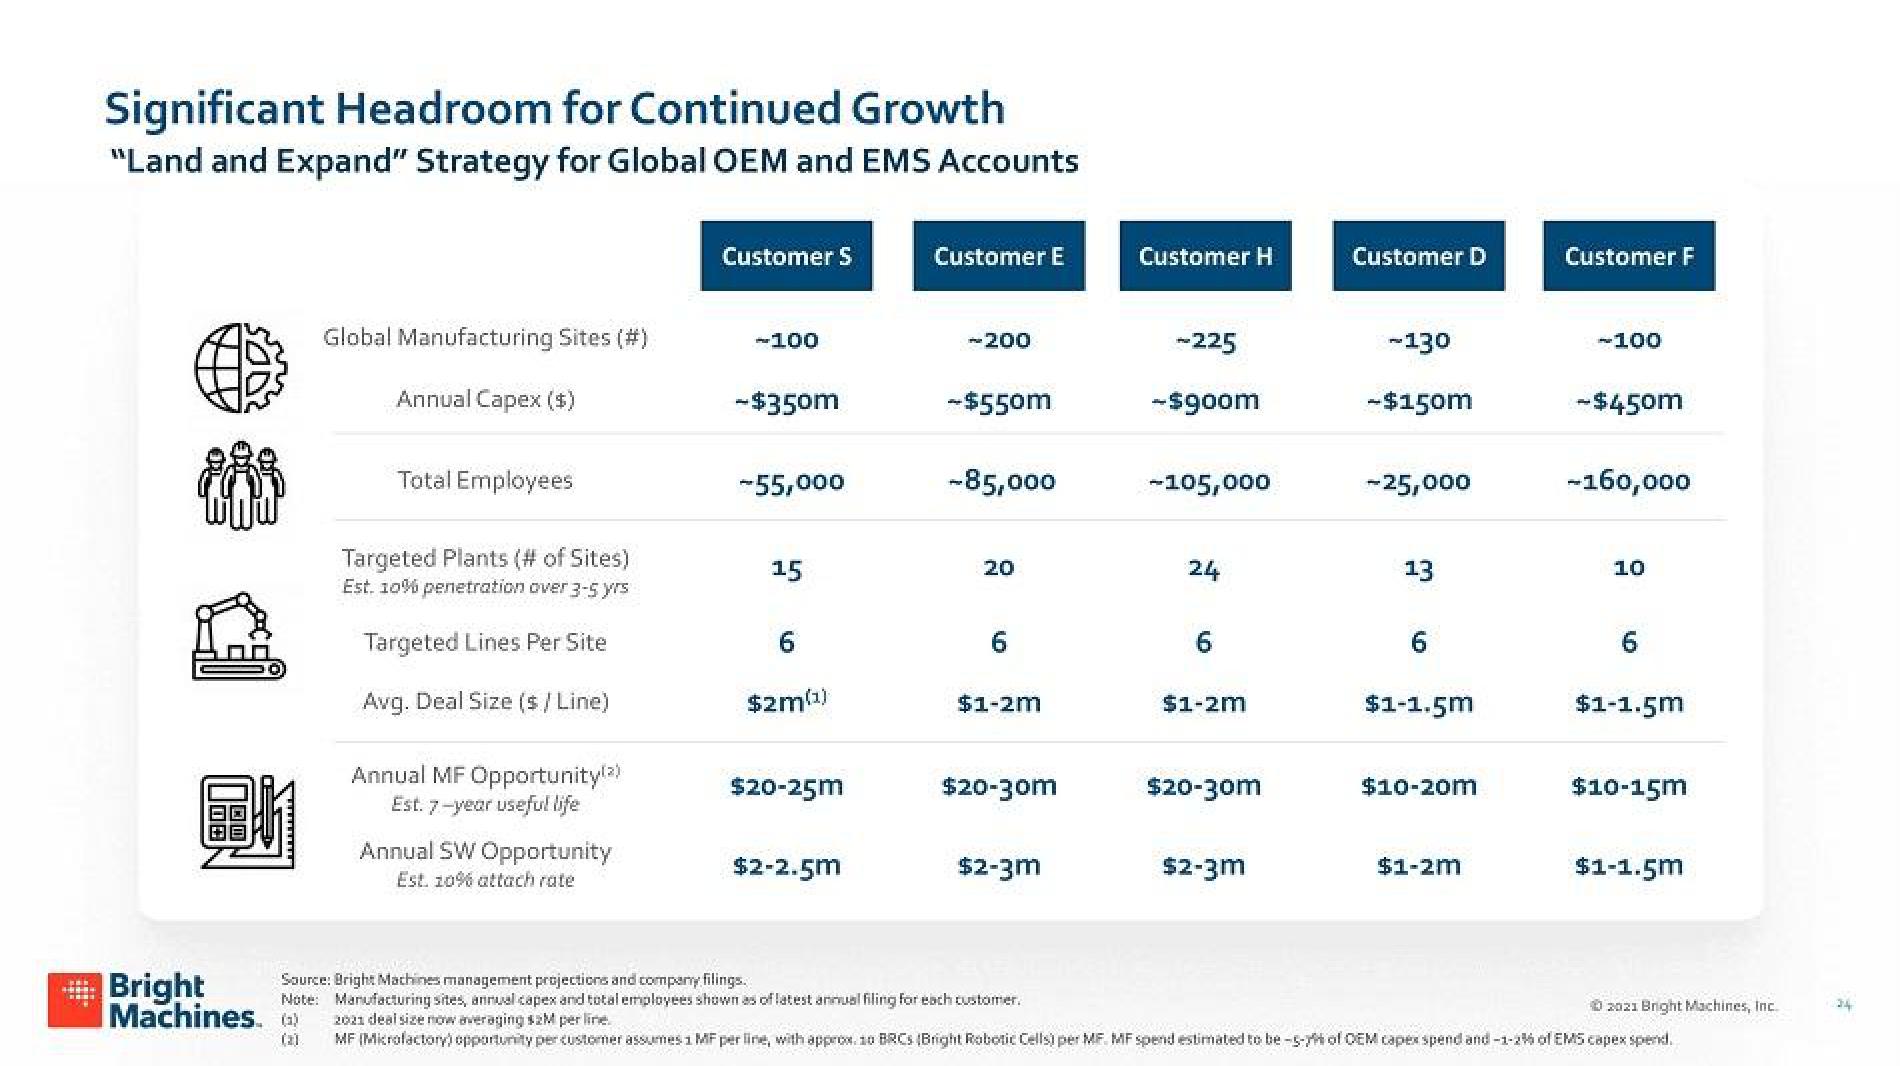
Significant Headroom for Continued Growth
"Land and Expand" Strategy for Global OEM and EMS Accounts
BI
Bright
Machines. (2)
(2)
Global Manufacturing Sites (#)
Annual Capex ($)
Total Employees
Targeted Plants (# of Sites)
Est. 10% penetration over 3-5 yrs
Targeted Lines Per Site
Avg. Deal Size ($ / Line)
Annual MF Opportunity(2)
Est. 7-year useful life
Annual SW Opportunity
Est. 10% attach rate
Customer S
-100
-$350m
-55,000
15
6
$2m(¹)
$20-25m
$2-2.5m
Customer E
-200
-$550m
-85,000
20
6
$1-2m
$20-30m
$2-3m
Customer H
-225
-$900m
-105,000
24
6
$1-2m
$20-30m
$2-3m
Customer D
-130
-$150m
- 25,000
13
6
$1-1.5m
$10-20m
$1-2m
Customer F
-100
-$450m
-160,000
10
6
$1-1.5m
$10-15m
$1-1.5m
Source: Bright Machines management projections and company filings.
Note: Manufacturing sites, annual capex and total employees shown as of latest annual filing for each customer.
Ⓒ2021 Bright Machines, Inc.
2021 deal size now averaging $2M per line.
MF (Microfactory) opportunity per customer assumes 1 MF per line, with approx. 10 BRCS (Bright Robotic Cells) per MF. MF spend estimated to be-5-7 of OEM capex spend and -1-2% of EMS capex spend.View entire presentation