Pathward Financial Results Presentation Deck
Non-GAAP Reconciliation
30
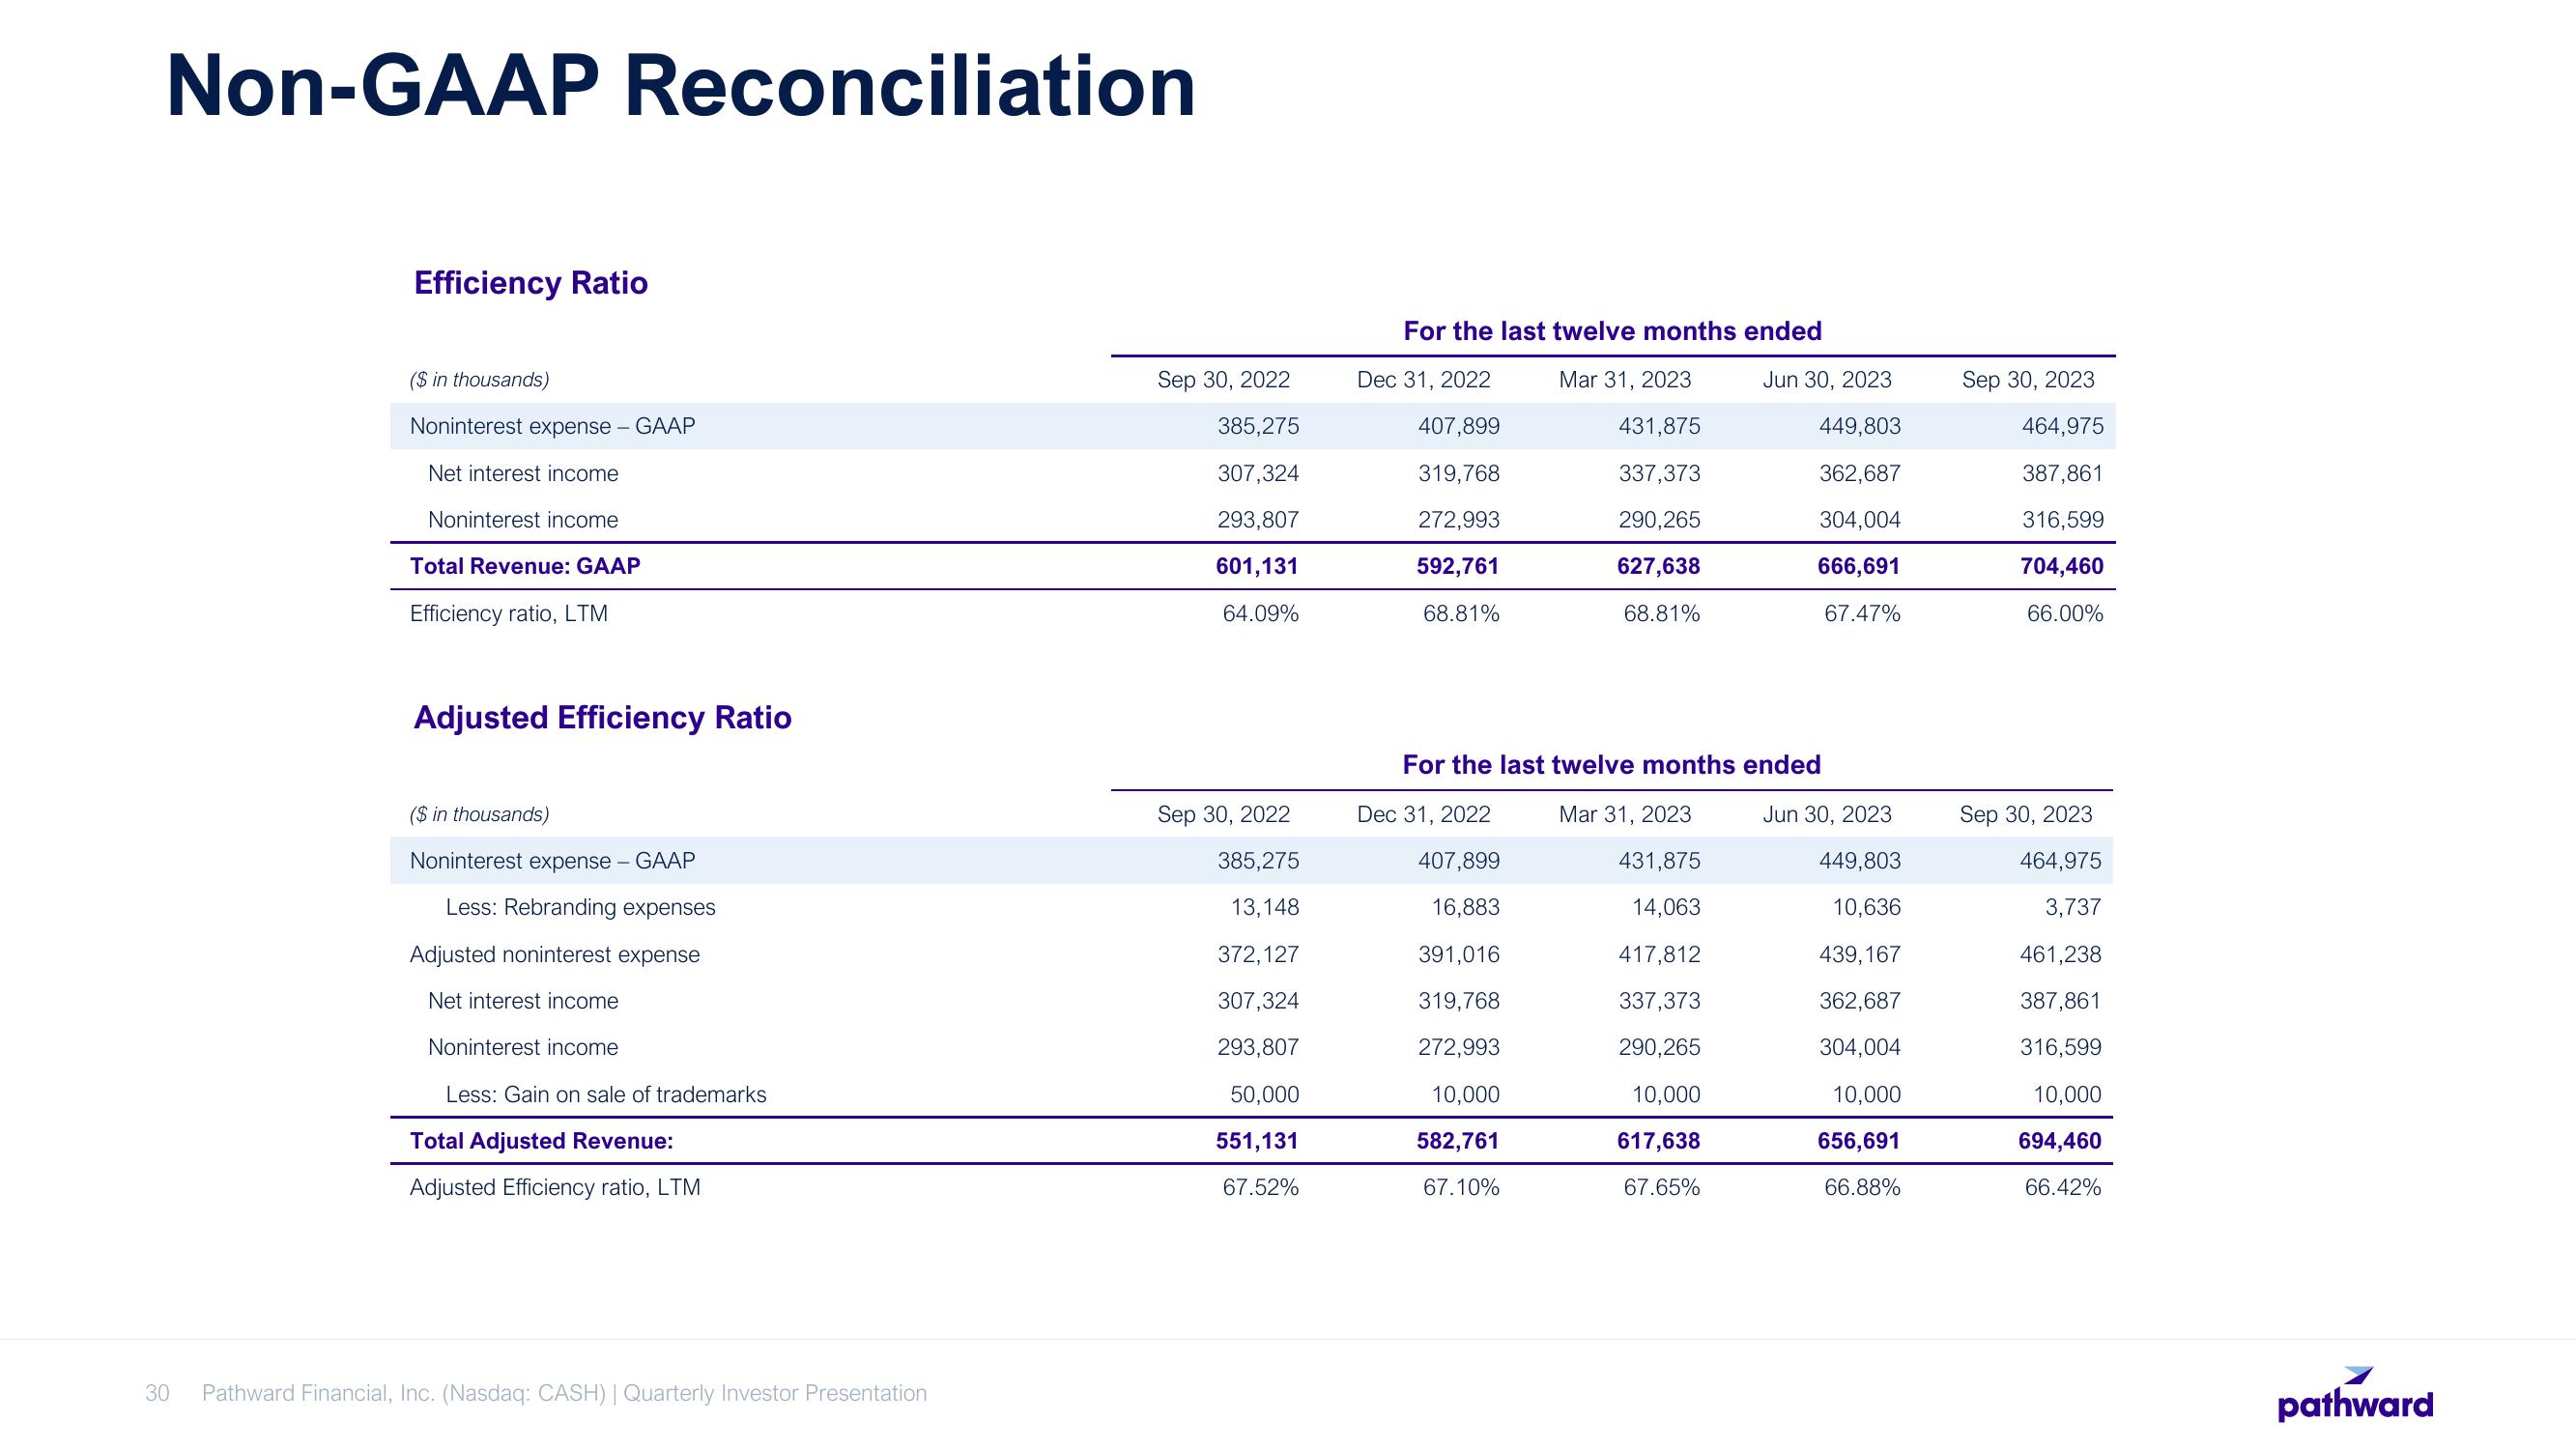
Efficiency Ratio
($ in thousands)
Noninterest expense - GAAP
Net interest income
Noninterest income
Total Revenue: GAAP
Efficiency ratio, LTM
Adjusted Efficiency Ratio
($ in thousands)
Noninterest expense -
GAAP
Less: Rebranding expenses
Adjusted noninterest expense
Net interest income
Noninterest income
Less: Gain on sale of trademarks
Total Adjusted Revenue:
Adjusted Efficiency ratio, LTM
Pathward Financial, Inc. (Nasdaq: CASH) | Quarterly Investor Presentation
Sep 30, 2022
385,275
307,324
293,807
601,131
64.09%
Sep 30, 2022
385,275
13,148
372,127
307,324
293,807
50,000
551,131
67.52%
For the last twelve months ended
Mar 31, 2023
431,875
337,373
290,265
627,638
68.81%
Dec 31, 2022
407,899
319,768
272,993
592,761
68.81%
Jun 30, 2023
449,803
362,687
304,004
666,691
67.47%
For the last twelve months ended
Mar 31, 2023
431,875
14,063
417,812
337,373
290,265
10,000
617,638
67.65%
Dec 31, 2022
407,899
16,883
391,016
319,768
272,993
10,000
582,761
67.10%
Jun 30, 2023
449,803
10,636
439,167
362,687
304,004
10,000
656,691
66.88%
Sep 30, 2023
464,975
387,861
316,599
704,460
66.00%
Sep 30, 2023
464,975
3,737
461,238
387,861
316,599
10,000
694,460
66.42%
pathwardView entire presentation