Uber Results Presentation Deck
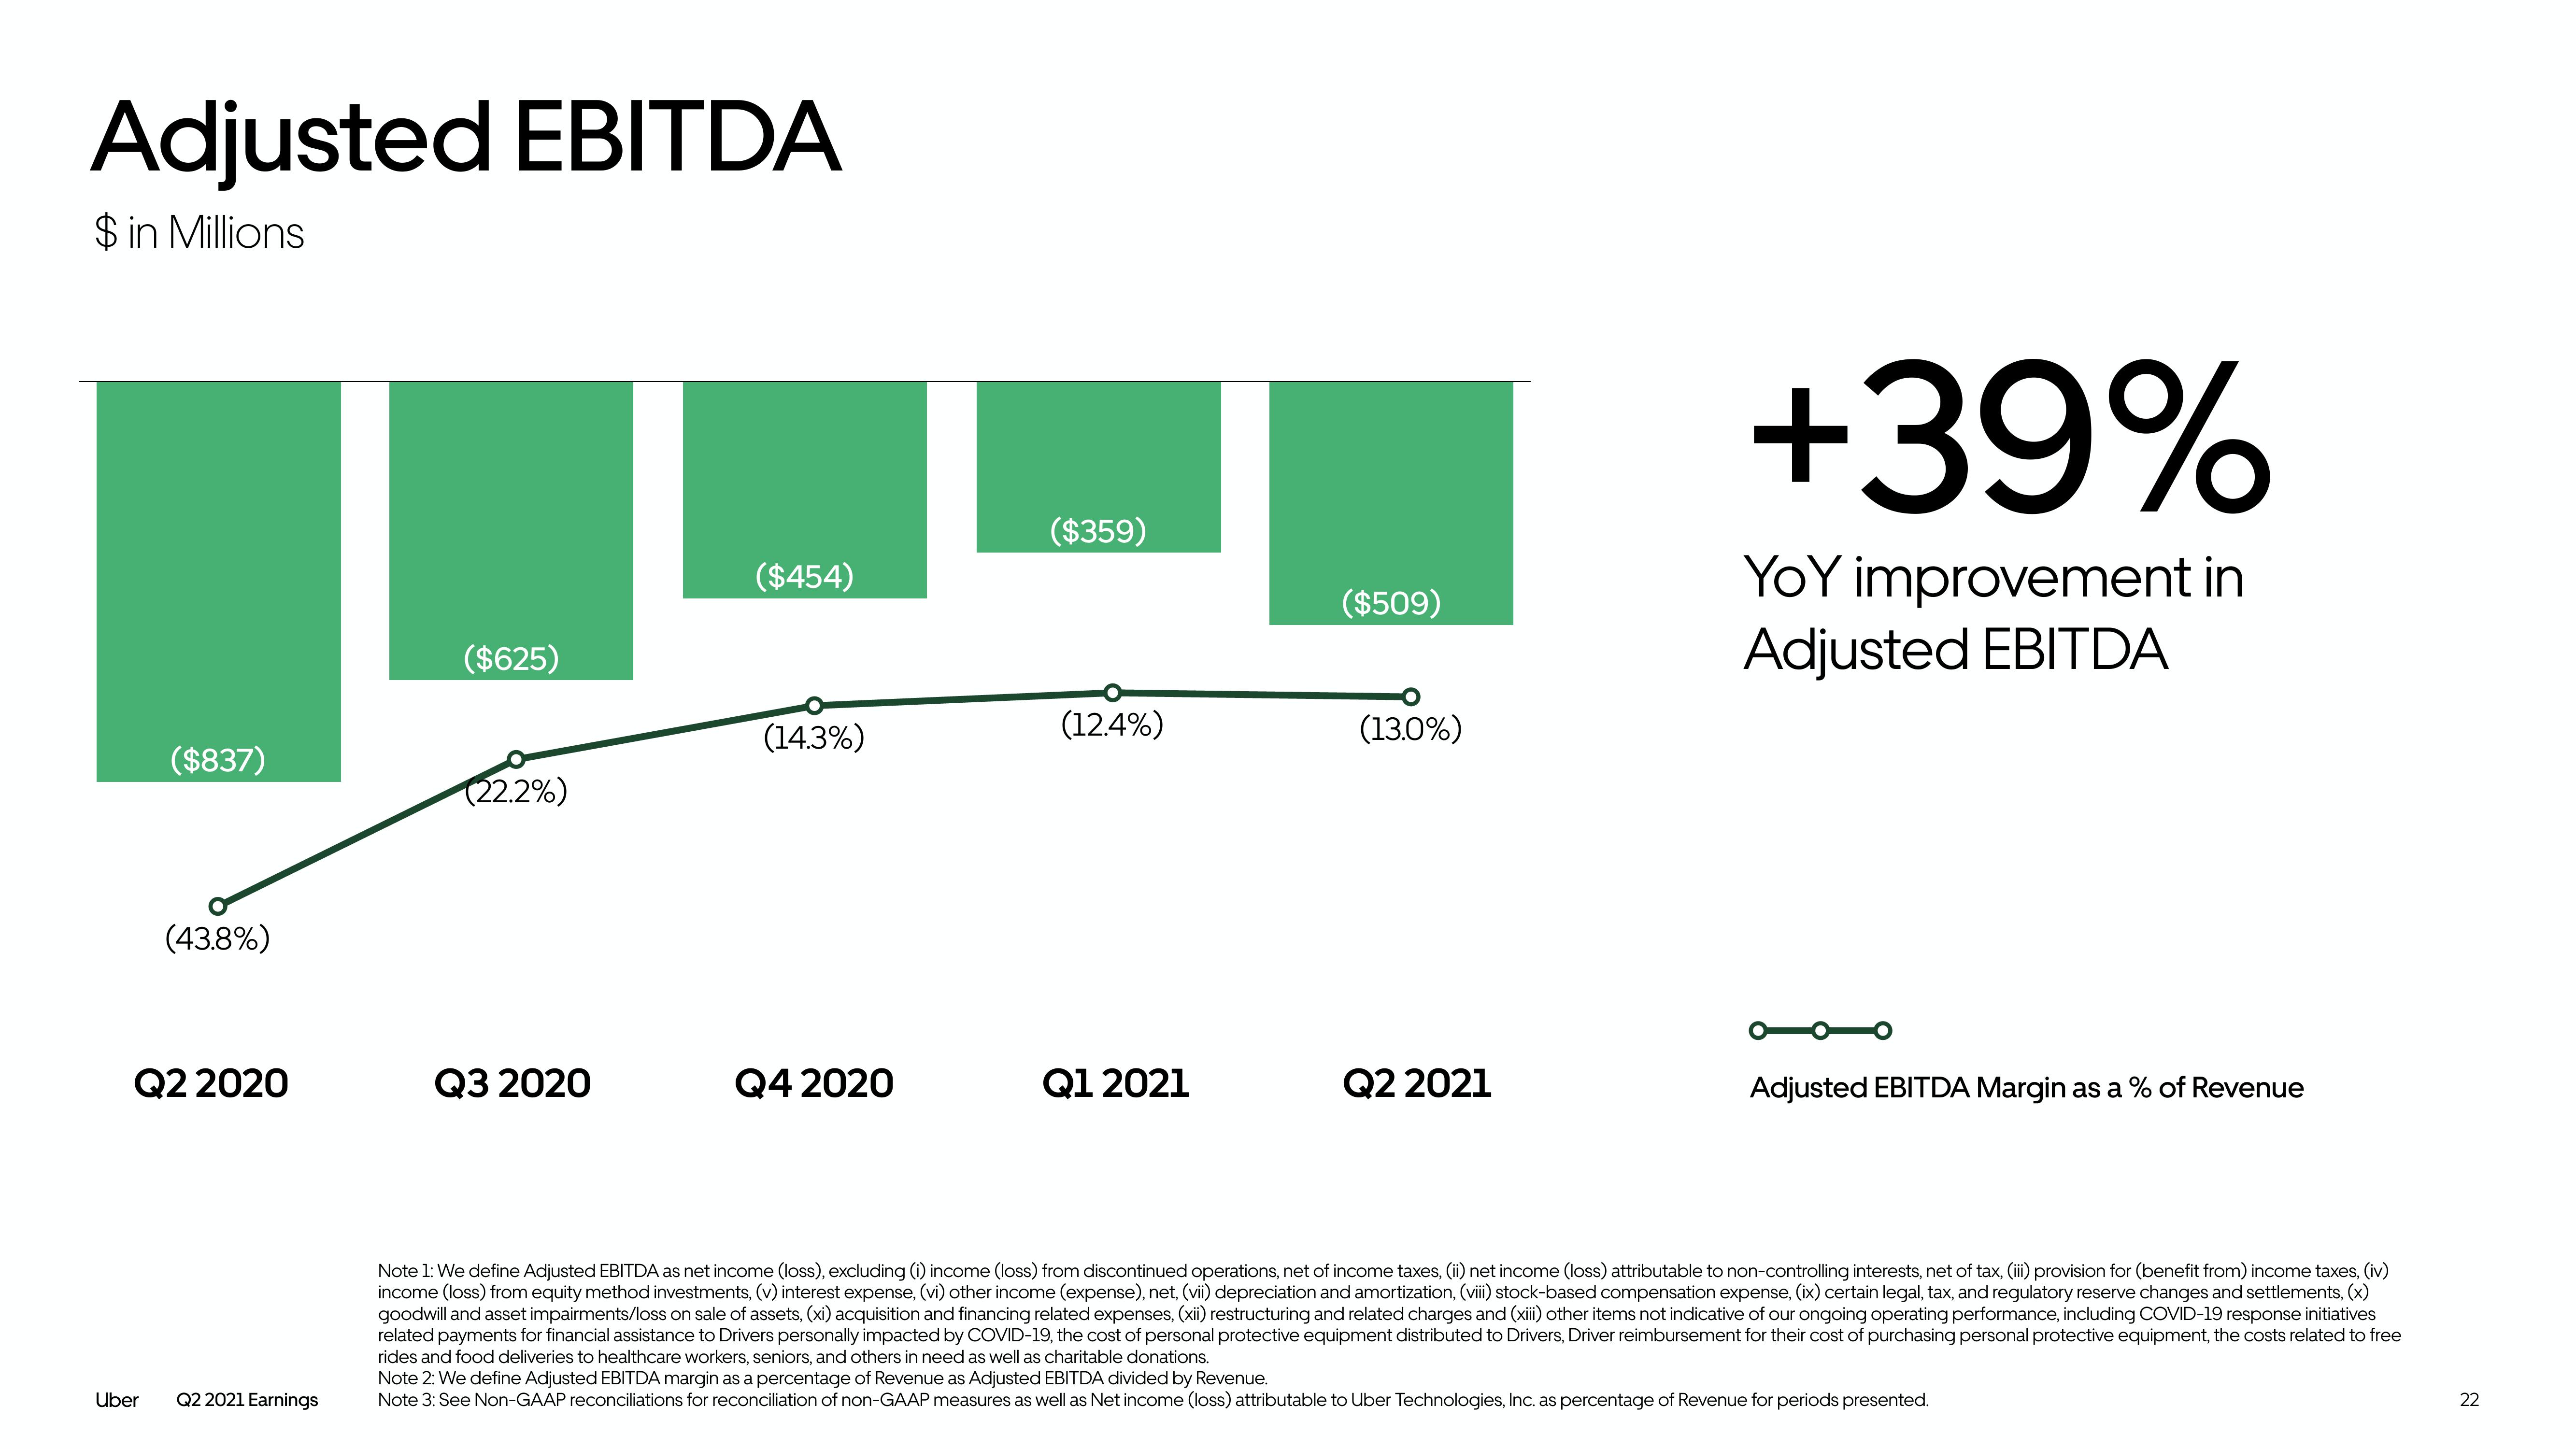
Adjusted EBITDA
$ in Millions
($837)
Uber
(43.8%)
Q2 2020
Q2 2021 Earnings
($625)
(22.2%)
Q3 2020
($454)
(14.3%)
Q4 2020
($359)
(12.4%)
Q1 2021
($509)
(13.0%)
Q2 2021
+39%
YoY improvement in
Adjusted EBITDA
Adjusted EBITDA Margin as a % of Revenue
Note 1: We define Adjusted EBITDA as net income (loss), excluding (i) income (loss) from discontinued operations, net of income taxes, (ii) net income (loss) attributable to non-controlling interests, net of tax, (iii) provision for (benefit from) income taxes, (iv)
income (loss) from equity method investments, (v) interest expense, (vi) other income (expense), net, (vii) depreciation and amortization, (viii) stock-based compensation expense, (ix) certain legal, tax, and regulatory reserve changes and settlements, (x)
goodwill and asset impairments/loss on sale of assets, (xi) acquisition and financing related expenses, (xii) restructuring and related charges and (xiii) other items not indicative of our ongoing operating performance, including COVID-19 response initiatives
related payments for financial assistance to Drivers personally impacted by COVID-19, the cost of personal protective equipment distributed to Drivers, Driver reimbursement for their cost of purchasing personal protective equipment, the costs related to free
rides and food deliveries to healthcare workers, seniors, and others in need as well as charitable donations.
Note 2: We define Adjusted EBITDA margin as a percentage of Revenue as Adjusted EBITDA divided by Revenue.
Note 3: See Non-GAAP reconciliations for reconciliation of non-GAAP measures as well as Net income (loss) attributable to Uber Technologies, Inc. as percentage of Revenue for periods presented.
22View entire presentation