Goldman Sachs Results Presentation Deck
Assets Under Supervision
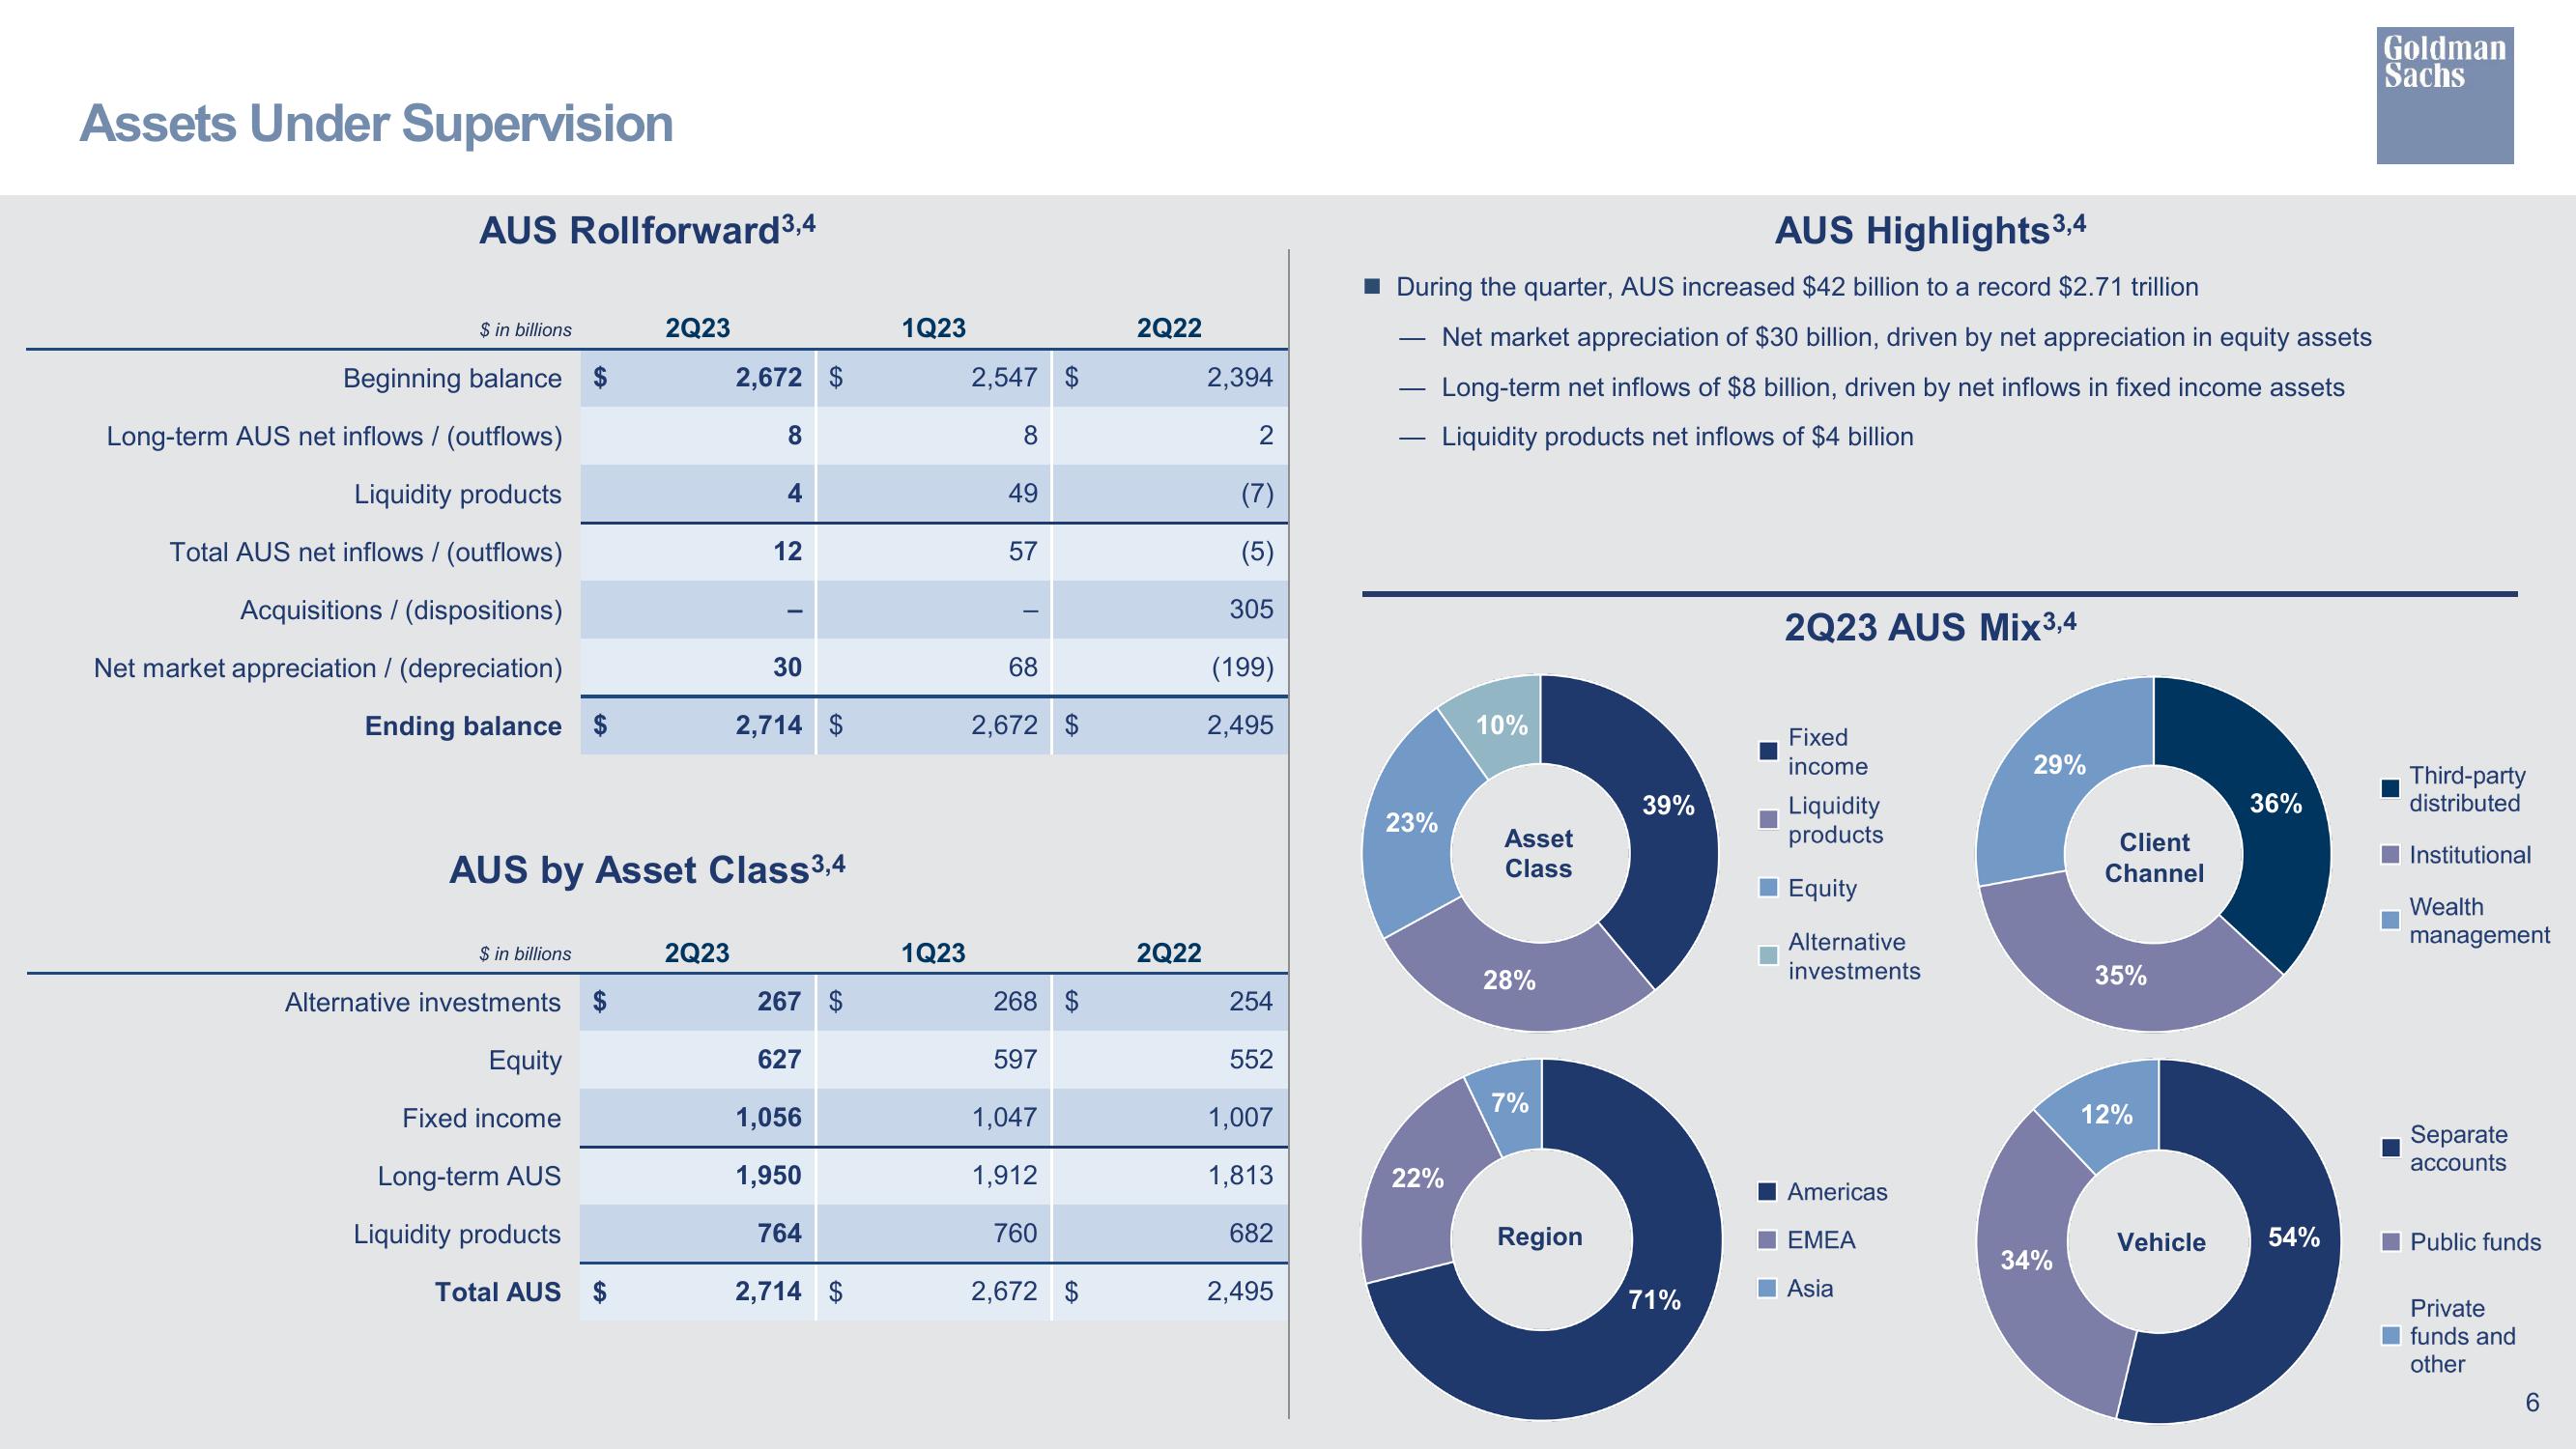
AUS Rollforward³,4
$ in billions
Beginning balance
Long-term AUS net inflows / (outflows)
Liquidity products
Total AUS net inflows / (outflows)
Acquisitions / (dispositions)
Net market appreciation / (depreciation)
Ending balance
$ in billions
Alternative investments
Equity
Fixed income
Long-term AUS
Liquidity products
2Q23
Total AUS
2,672 $
2Q23
8
AUS by Asset Class 3,4
4
12
30
2,714 $
267 $
627
1,056
1,950
764
2,714 $
1Q23
1Q23
2,547 $
8
49
57
68
2,672 $
268 $
597
1,047
1,912
760
2,672 $
2Q22
2Q22
2,394
2
(7)
305
(199)
2,495
254
552
1,007
1,813
682
2,495
AUS Highlights 3,4
During the quarter, AUS increased $42 billion to a record $2.71 trillion
Net market appreciation of $30 billion, driven by net appreciation in equity assets
Long-term net inflows of $8 billion, driven by net inflows in fixed income assets
Liquidity products net inflows of $4 billion
23%
22%
10%
Asset
Class
28%
7%
Region
39%
71%
2Q23 AUS Mix3,4
Fixed
income
Liquidity
products
Equity
Alternative
investments
Americas
EMEA
Asia
29%
34%
Client
Channel
35%
12%
Vehicle
36%
54%
Goldman
Sachs
Third-party
distributed
Institutional
Wealth
management
Separate
accounts
Public funds
Private
funds and
other
6View entire presentation