DraftKings Investor Day Presentation Deck
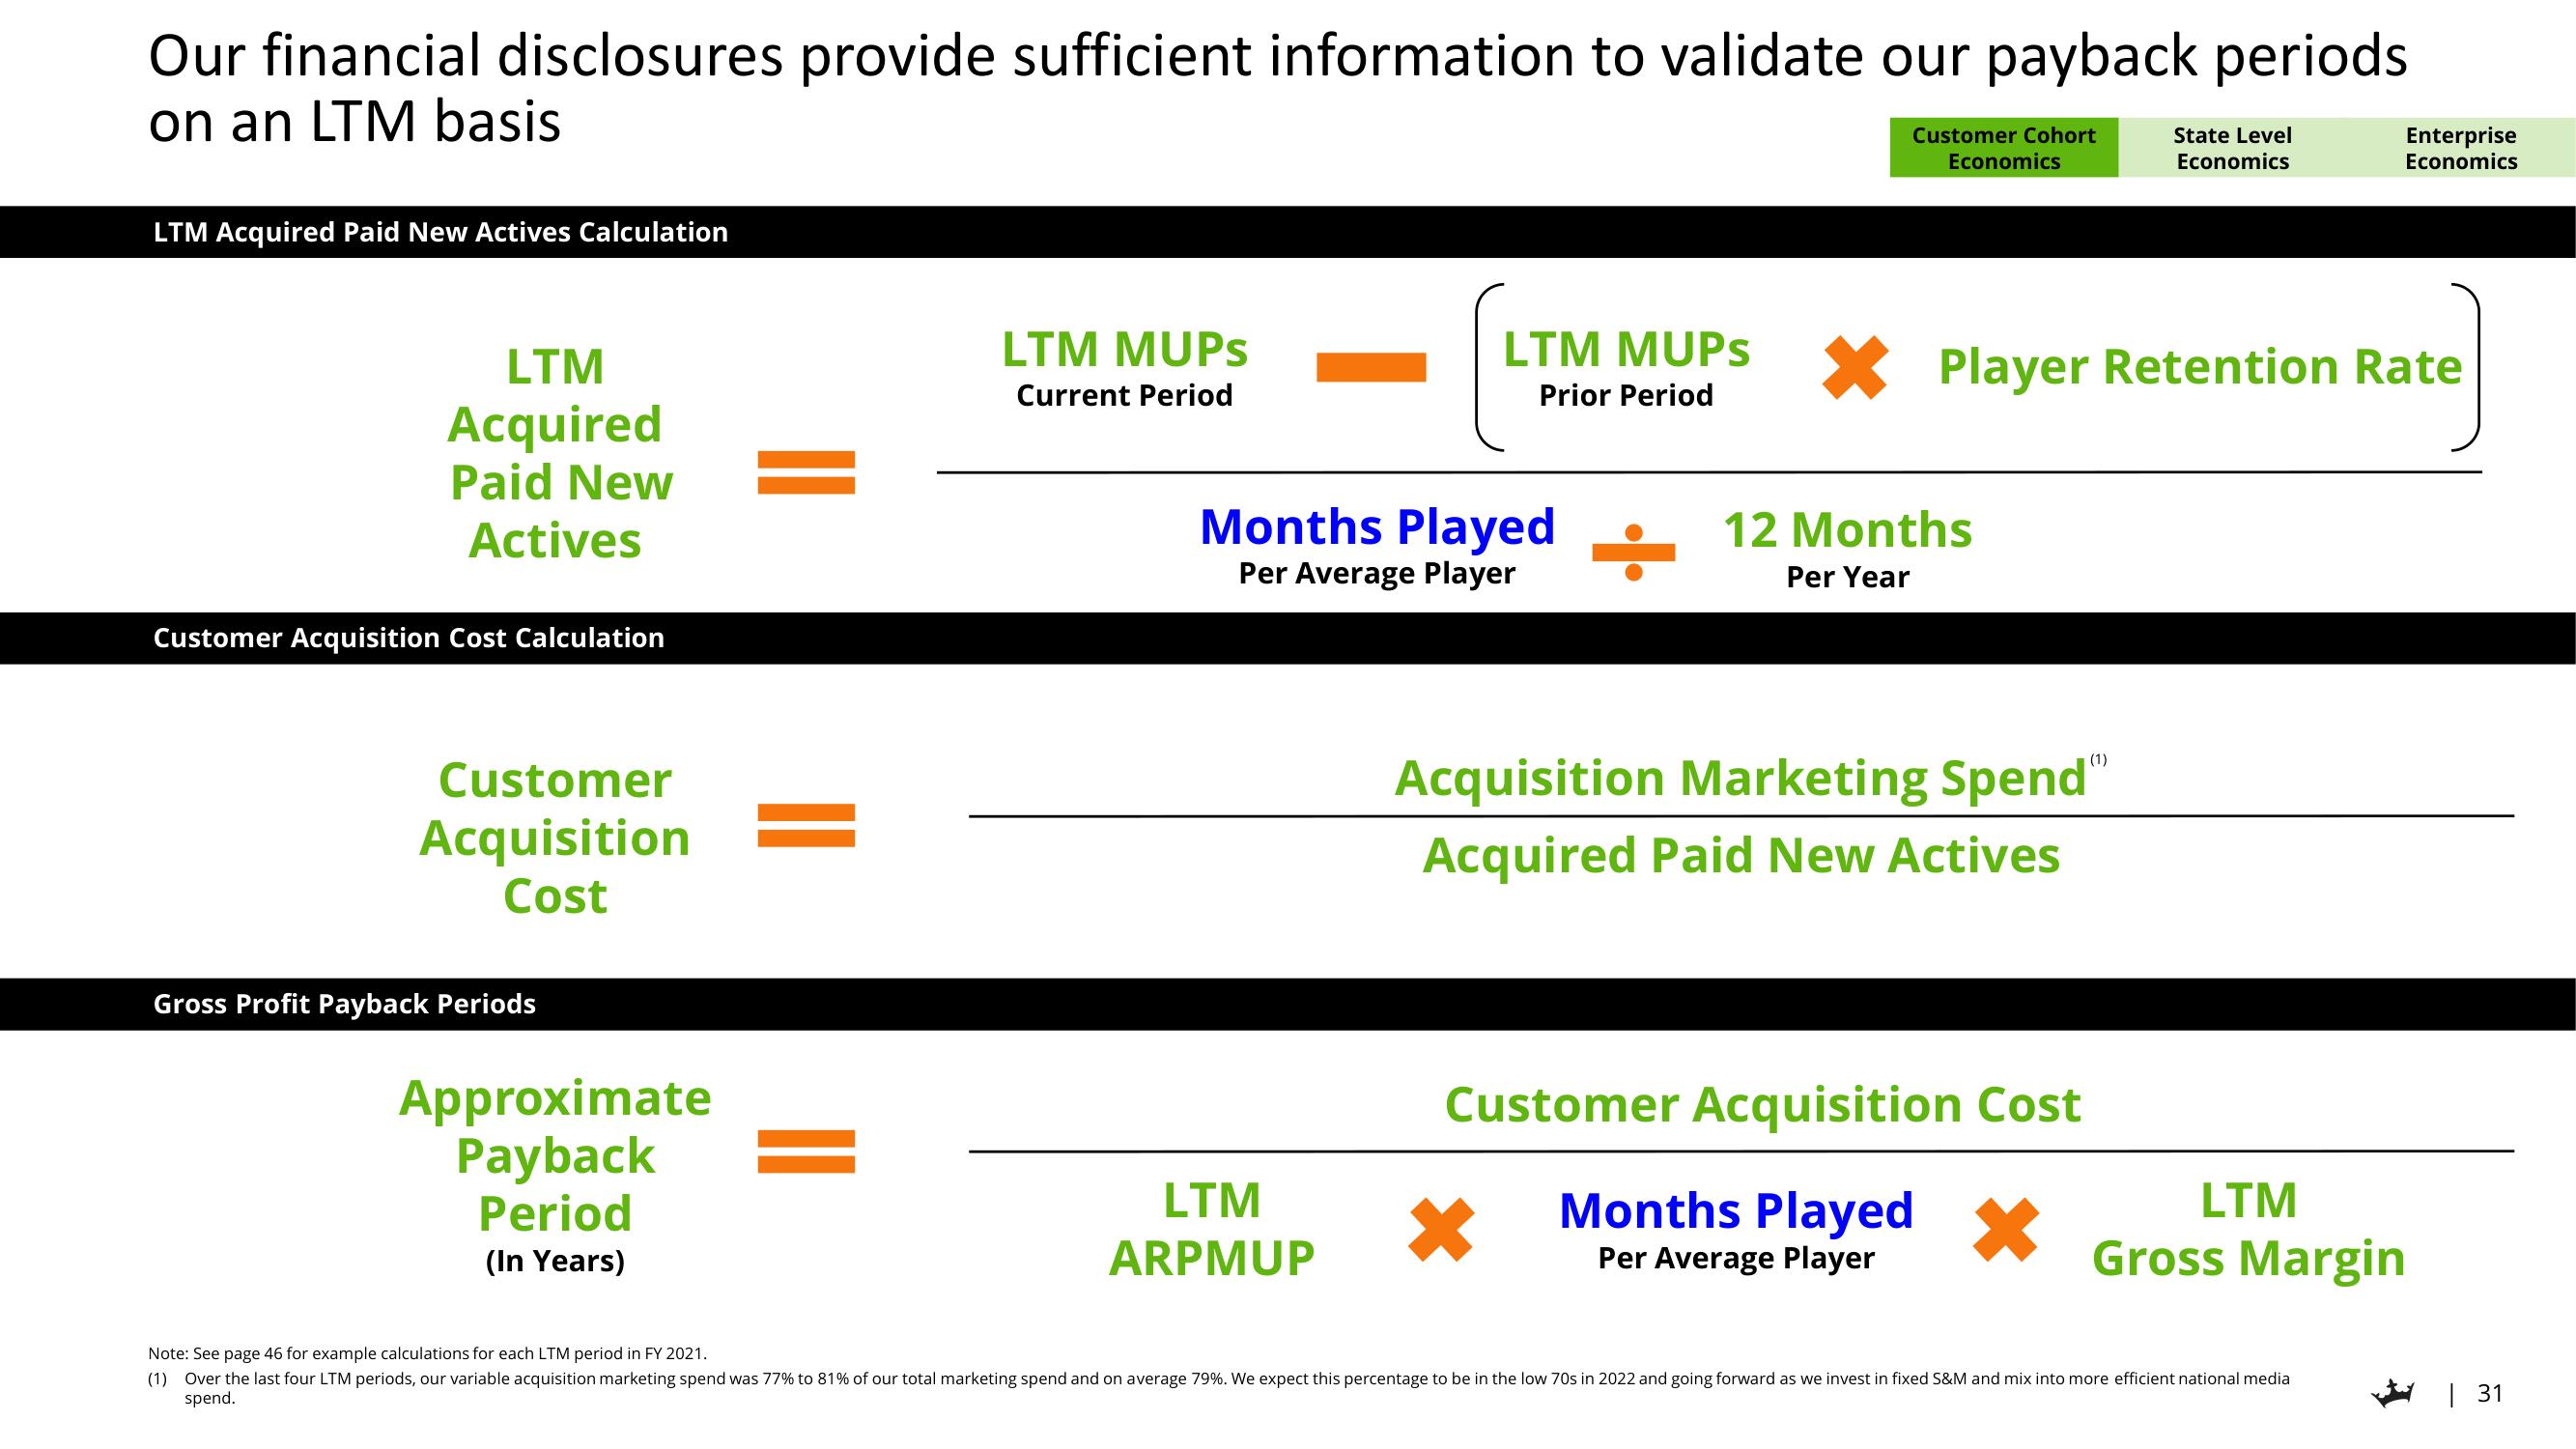
Our financial disclosures provide sufficient information to validate our payback periods
on an LTM basis
LTM Acquired Paid New Actives Calculation
LTM
Acquired
Paid New
Actives
Customer Acquisition Cost Calculation
Customer
Acquisition
Cost
Gross Profit Payback Periods
Approximate
Payback
Period
(In Years)
LTM MUPS
Current Period
Months Played
Per Average Player
LTM
ARPMUP
LTM MUPS
Prior Period
Customer Cohort
Economics
x
12 Months
Per Year
Acquisition Marketing Spend"
Acquired Paid New Actives
Player Retention Rate
Customer Acquisition Cost
Months Played
Per Average Player
State Level
Economics
Enterprise
Economics
LTM
Gross Margin
Note: See page 46 for example calculations for each LTM period in FY 2021.
(1) Over the last four LTM periods, our variable acquisition marketing spend was 77% to 81% of our total marketing spend and on average 79%. We expect this percentage to be in the low 70s in 2022 and going forward as we invest in fixed S&M and mix into more efficient national media
spend.
| 31View entire presentation